Intraday Money Management Indicator
Class: trend indicator
Trading type: intraday trading
Time frame: 1H
Purpose: intraday work in trend
Level of aggressiveness: standard
Indicator «IMMI» (Intraday Money Management Indicator) is our attempt to combine technical analysis with money management and put it into a form of technical indicator.
Using our unique mechanics of trend detection earlier proposed in “KenJi” indicator we follow basic money management rules to define moments when trading is reasonable and when it is not. To do this we calculate profit/stop ratio at each moment of time.
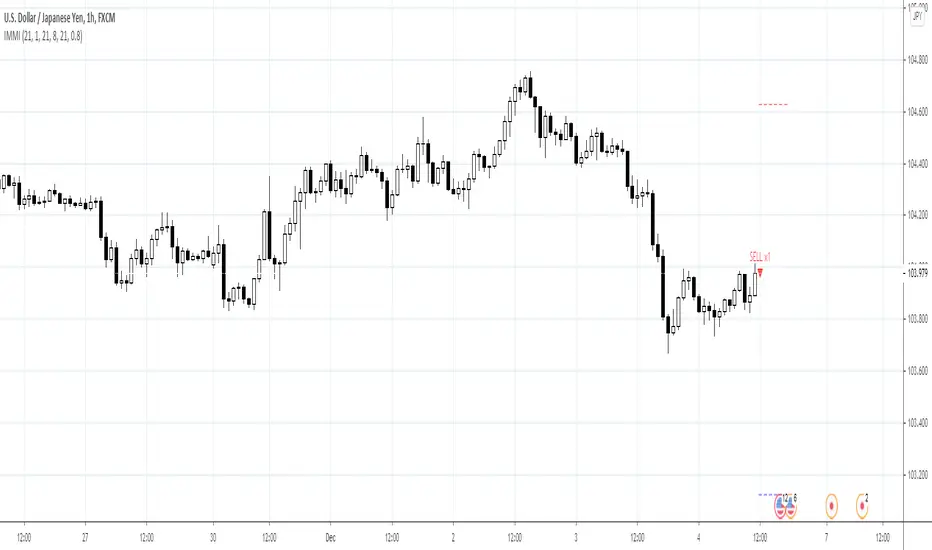
To ease the trading process indicator «IMMI» displays on the chart stop-loss and take-profit lines as well as trading signals.
Structure of the indicator
Stop-loss lines are marked red and take-profit lines are marked blue. Depending on current trend the stop-loss lines can be above current price (case of downward trend) and below current price (case of upward trend). The same is true for the take-profit lines: they are above current price when the upward trend is detected and below for the case of downward trend.
To ease the trading process indicator displays on the chart “buy” and “sell” signals. These signals are divided into 2 groups: standard (trading with basic lot size) and aggressive (trading with double basic lot size). Aggressive signals appear when profit/stop ratio is above 2.
When no tendency is detected or current prices are inappropriate from the position of money management, “NO SIGNAL” mark is displayed on the chart.
Input parameters of the indicator
To set up the indicator a number of input parameters are used:
- Slow Average Period – period of the slow average. The bigger the period is the more conservative reaction of the average for the price changes are.
- Fast Average Period - period of the fast average. The bigger the period is the more conservative reaction of the average for the price changes are;
- Correlation Period – period used in correlation analysis to calculate the level of interconnection between the averages;
- Correlation Level – threshold for the level of correlation used to define trend. The higher the value is the more confirmed the trend is;
- Levels Period - period used to calculate stop-loss and take-profit values.
- Aggressiveness – the higher the value is the wider stop-loss and take-profit lines are.
Rules of trading
When signal “buy”/”sell” is appeared on the chart corresponding trade can be opened.
Position should be fixed by profit near the profit line (blue line) or closed with stop near stop-loss line (red line). In any case at the end of the day position should be closed.
Access to the indicator
Please address all questions about this indicator (including access to it) in private messages.
สคริปต์แบบเฉพาะผู้ได้รับเชิญเท่านั้น
เฉพาะผู้ใช้งานที่ผู้เขียนอนุมัตเท่านั้นจึงจะสามารถเข้าถึงสคริปต์นี้ได้ คุณจะต้องขอและได้รับอนุญาตก่อนใช้งาน ซึ่งโดยทั่วไปจะได้รับอนุญาตหลังจากชำระเงินแล้ว สำหรับรายละเอียดเพิ่มเติม โปรดทำตามคำแนะนำของผู้เขียนด้านล่าง หรือติดต่อ Trade24Fx โดยตรง
TradingView ไม่แนะนำให้จ่ายเงินหรือใช้สคริปต์ เว้นแต่คุณจะเชื่อถือผู้เขียนและเข้าใจวิธีการทำงานของสคริปต์นั้นอย่างถ่องแท้ คุณยังสามารถหาทางเลือกแบบโอเพนซอร์สฟรีได้ใน สคริปต์ชุมชนของเรา
คำแนะนำของผู้เขียน
bit.ly/2oBvkHY
Больше информации на нашем ютьюб-канале
youtube.com/channel/UCYEOurJfasXWyYnrriGwsqQ
คำจำกัดสิทธิ์ความรับผิดชอบ
สคริปต์แบบเฉพาะผู้ได้รับเชิญเท่านั้น
เฉพาะผู้ใช้งานที่ผู้เขียนอนุมัตเท่านั้นจึงจะสามารถเข้าถึงสคริปต์นี้ได้ คุณจะต้องขอและได้รับอนุญาตก่อนใช้งาน ซึ่งโดยทั่วไปจะได้รับอนุญาตหลังจากชำระเงินแล้ว สำหรับรายละเอียดเพิ่มเติม โปรดทำตามคำแนะนำของผู้เขียนด้านล่าง หรือติดต่อ Trade24Fx โดยตรง
TradingView ไม่แนะนำให้จ่ายเงินหรือใช้สคริปต์ เว้นแต่คุณจะเชื่อถือผู้เขียนและเข้าใจวิธีการทำงานของสคริปต์นั้นอย่างถ่องแท้ คุณยังสามารถหาทางเลือกแบบโอเพนซอร์สฟรีได้ใน สคริปต์ชุมชนของเรา
คำแนะนำของผู้เขียน
bit.ly/2oBvkHY
Больше информации на нашем ютьюб-канале
youtube.com/channel/UCYEOurJfasXWyYnrriGwsqQ