PROTECTED SOURCE SCRIPT
ที่อัปเดต: Pivot Points Standard M, W, D (Monthly, Weekly & Daily)
This script is based on Pivot Point Standard and is intended for educational purposes only.
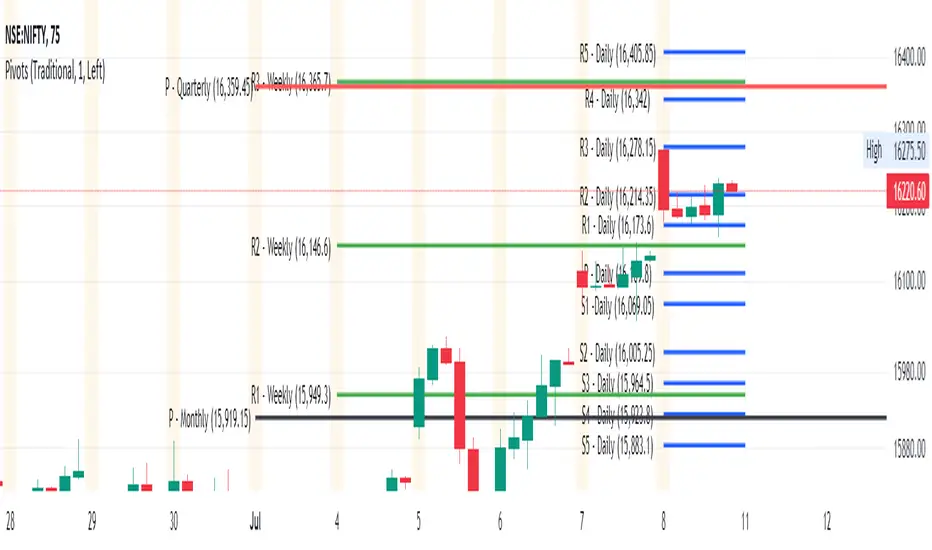
"Pivot points are a technical indicator that is used to determine the levels at which price may face support or resistance.
Pivot Points indicator consists of a Pivot (P) level, several support (S) and several resistance (R)."
You can view the Daily timeframe - support/resistance.
You can view the Weekly timeframe - support/resistance.
You can view the Monthly timeframe - support/resistance.
Options to choose "Traditional" or "Fibonacci" or "Woodie" or "Classic" or "DM" or "Camarilla"
Options to choose historical pivots (Number of Pivots Back)
This tool can be handy in any trading process from short-long term trades or timeframes, multiple timeframe analysis, trend trades, swing trades, position trades, and momentum trades.
Credits
Credits to TradingView for original built-in source code
เอกสารเผยแพร่
July 2022 Update Option to Change the Colour for Daily / Weekly / Monthly Pivots
Option to Show Prices
เอกสารเผยแพร่
Pivots Quarterly and Pivots Yearly Timeframe addedOption to Choose the Timeframe Daily / Weekly / Monthly / Quarterly / Yearly Pivots
Option to Change the Color for Daily / Weekly / Monthly / Quarterly / Yearly Pivots
สคริปต์ที่ได้รับการป้องกัน
สคริปต์นี้ถูกเผยแพร่เป็นแบบ closed-source อย่างไรก็ตาม คุณสามารถใช้ได้อย่างอิสระและไม่มีข้อจำกัดใดๆ – เรียนรู้เพิ่มเติมได้ที่นี่
คำจำกัดสิทธิ์ความรับผิดชอบ
ข้อมูลและบทความไม่ได้มีวัตถุประสงค์เพื่อก่อให้เกิดกิจกรรมทางการเงิน, การลงทุน, การซื้อขาย, ข้อเสนอแนะ หรือคำแนะนำประเภทอื่น ๆ ที่ให้หรือรับรองโดย TradingView อ่านเพิ่มเติมใน ข้อกำหนดการใช้งาน