OPEN-SOURCE SCRIPT
ที่อัปเดต: liquidity volume

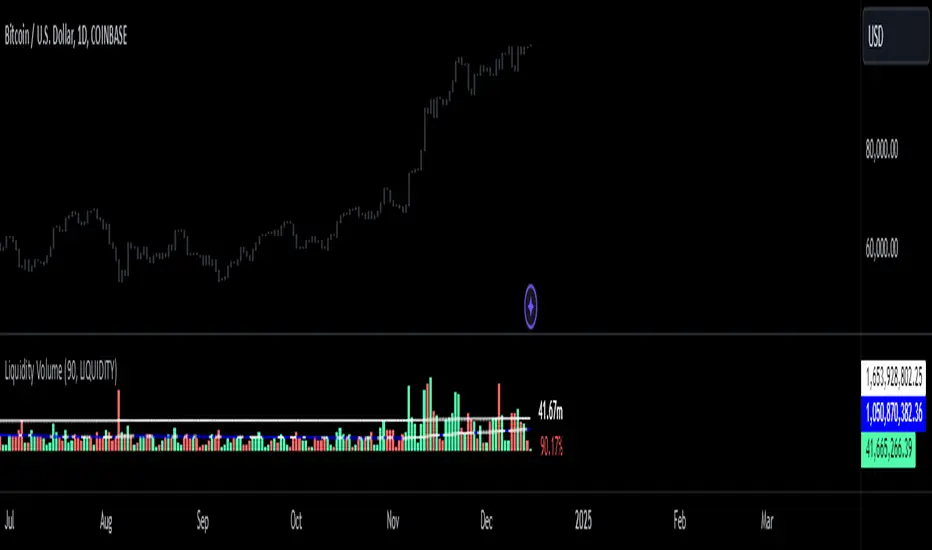
just like volume, this indicator shows how much in dollars were traded in millions.
เอกสารเผยแพร่
made the volume bars represent colors based on bearish or bullish movementเอกสารเผยแพร่
added a mean (average) to the script. เอกสารเผยแพร่
added a 3rd standard deviation to the indicator. a 3sd occurrence has a 0.2% chance of occurrence on a statistical standpoint. but when it comes to markets it happens more often. nonetheless, a 3sd alert can signify a major market movement due to increase of activity of dollars going in or out of that asset you are observing. P.S.A. go on settings, under style tab, change the "price line" to a histogram. เอกสารเผยแพร่
changed the plotted liqudity to a column เอกสารเผยแพร่
when the line is purple that means that liquidity is going down. when the line is white that means liquidity is going up เอกสารเผยแพร่
ive made improvements on the script. easier to use and readเอกสารเผยแพร่
made a little bit more modificationเอกสารเผยแพร่
you can switch from representation of liquidity and equity. equity is just normal volumeเอกสารเผยแพร่
we have added a new stat. you can see how much volume has increased/decreased from the previous bar in percentageเอกสารเผยแพร่
modified the separation of labels so no overlapping occursเอกสารเผยแพร่
สคริปต์โอเพนซอร์ซ
ด้วยเจตนารมณ์หลักของ TradingView ผู้สร้างสคริปต์นี้ได้ทำให้เป็นโอเพนซอร์ส เพื่อให้เทรดเดอร์สามารถตรวจสอบและยืนยันฟังก์ชันการทำงานของมันได้ ขอชื่นชมผู้เขียน! แม้ว่าคุณจะใช้งานได้ฟรี แต่โปรดจำไว้ว่าการเผยแพร่โค้ดซ้ำจะต้องเป็นไปตาม กฎระเบียบการใช้งาน ของเรา
คำจำกัดสิทธิ์ความรับผิดชอบ
ข้อมูลและบทความไม่ได้มีวัตถุประสงค์เพื่อก่อให้เกิดกิจกรรมทางการเงิน, การลงทุน, การซื้อขาย, ข้อเสนอแนะ หรือคำแนะนำประเภทอื่น ๆ ที่ให้หรือรับรองโดย TradingView อ่านเพิ่มเติมใน ข้อกำหนดการใช้งาน