OPEN-SOURCE SCRIPT
ที่อัปเดต: Heiken Ashi Lower Pane
Not one of my more challenging scripts, never the less I was requested to publish this open source indicator.
Heiken Ashi (HA) candles indicate strength usually when the candles have wicks in the direction of the movement, ie. top wicks on green candles w/NO wicks on bottom and vice versa for bearish behavior (bottom wicks on red candles). Weakness in the movement CAN be spotted by watching for wicks opposite the movement appearing.
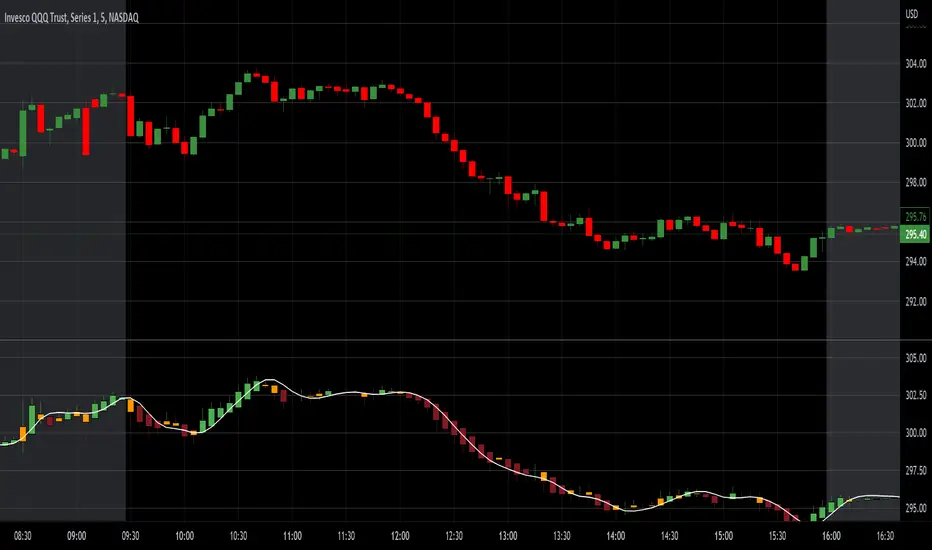
This indicator can be used in a lower pane to show heiken ashi candles concurrently with above main chart regular candles.
Nothing special about it other than displaying bull/bear ha candles with a twist of third color candle (orange default) which is shown when HA candle gets a wick in opposite direction of movement which usually indicates potential directional weakness.
It also provides various moving average line types based upon the HA high, low, close, open values (HLC4) that can used if you are into watching for a cross over of the HA candle to a MA line.
Note: You can also display this over the main chart as an overlay just by selecting the three dots on the indicator and "Move to" option. Be advised doing so will probably cause too much overlapping onto the regular candles.
Heiken Ashi (HA) candles indicate strength usually when the candles have wicks in the direction of the movement, ie. top wicks on green candles w/NO wicks on bottom and vice versa for bearish behavior (bottom wicks on red candles). Weakness in the movement CAN be spotted by watching for wicks opposite the movement appearing.
This indicator can be used in a lower pane to show heiken ashi candles concurrently with above main chart regular candles.
Nothing special about it other than displaying bull/bear ha candles with a twist of third color candle (orange default) which is shown when HA candle gets a wick in opposite direction of movement which usually indicates potential directional weakness.
It also provides various moving average line types based upon the HA high, low, close, open values (HLC4) that can used if you are into watching for a cross over of the HA candle to a MA line.
Note: You can also display this over the main chart as an overlay just by selecting the three dots on the indicator and "Move to" option. Be advised doing so will probably cause too much overlapping onto the regular candles.
เอกสารเผยแพร่
Fixed Bugs regarding timeframes and added multi time frame options.สคริปต์โอเพนซอร์ซ
ด้วยเจตนารมณ์หลักของ TradingView ผู้สร้างสคริปต์นี้ได้ทำให้เป็นโอเพนซอร์ส เพื่อให้เทรดเดอร์สามารถตรวจสอบและยืนยันฟังก์ชันการทำงานของมันได้ ขอชื่นชมผู้เขียน! แม้ว่าคุณจะใช้งานได้ฟรี แต่โปรดจำไว้ว่าการเผยแพร่โค้ดซ้ำจะต้องเป็นไปตาม กฎระเบียบการใช้งาน ของเรา
คำจำกัดสิทธิ์ความรับผิดชอบ
ข้อมูลและบทความไม่ได้มีวัตถุประสงค์เพื่อก่อให้เกิดกิจกรรมทางการเงิน, การลงทุน, การซื้อขาย, ข้อเสนอแนะ หรือคำแนะนำประเภทอื่น ๆ ที่ให้หรือรับรองโดย TradingView อ่านเพิ่มเติมใน ข้อกำหนดการใช้งาน
สคริปต์โอเพนซอร์ซ
ด้วยเจตนารมณ์หลักของ TradingView ผู้สร้างสคริปต์นี้ได้ทำให้เป็นโอเพนซอร์ส เพื่อให้เทรดเดอร์สามารถตรวจสอบและยืนยันฟังก์ชันการทำงานของมันได้ ขอชื่นชมผู้เขียน! แม้ว่าคุณจะใช้งานได้ฟรี แต่โปรดจำไว้ว่าการเผยแพร่โค้ดซ้ำจะต้องเป็นไปตาม กฎระเบียบการใช้งาน ของเรา
คำจำกัดสิทธิ์ความรับผิดชอบ
ข้อมูลและบทความไม่ได้มีวัตถุประสงค์เพื่อก่อให้เกิดกิจกรรมทางการเงิน, การลงทุน, การซื้อขาย, ข้อเสนอแนะ หรือคำแนะนำประเภทอื่น ๆ ที่ให้หรือรับรองโดย TradingView อ่านเพิ่มเติมใน ข้อกำหนดการใช้งาน