PROTECTED SOURCE SCRIPT
HMA High/Low Band - Trend Color
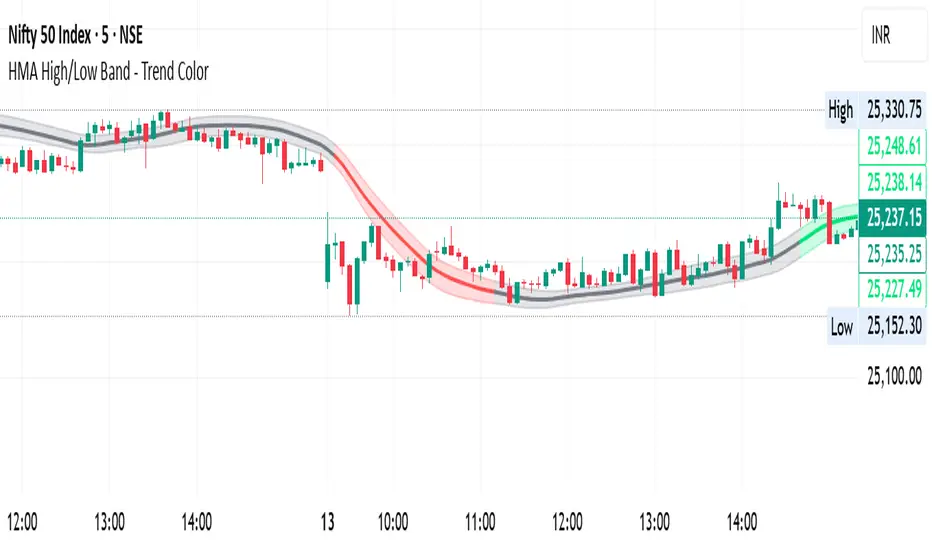
HMA High/Low Band Trend
Visualize market trends clearly with a single Hull Moving Average (HMA) and dynamic high/low bands. The indicator colors the HMA and its bands based on trend direction:
Green = Uptrend
Red = Downtrend
Gray = Sideways
The band adjusts dynamically to price action, giving a clear view of trending and sideways markets without cluttering your chart. Ideal for traders who want a smooth trend filter with instant visual cues.
สคริปต์ที่ได้รับการป้องกัน
สคริปต์นี้ถูกเผยแพร่เป็นแบบ closed-source อย่างไรก็ตาม คุณสามารถใช้ได้อย่างอิสระและไม่มีข้อจำกัดใดๆ – เรียนรู้เพิ่มเติมได้ที่นี่
คำจำกัดสิทธิ์ความรับผิดชอบ
ข้อมูลและบทความไม่ได้มีวัตถุประสงค์เพื่อก่อให้เกิดกิจกรรมทางการเงิน, การลงทุน, การซื้อขาย, ข้อเสนอแนะ หรือคำแนะนำประเภทอื่น ๆ ที่ให้หรือรับรองโดย TradingView อ่านเพิ่มเติมที่ ข้อกำหนดการใช้งาน