OPEN-SOURCE SCRIPT
[QG] Dynamic Zones Value Chart
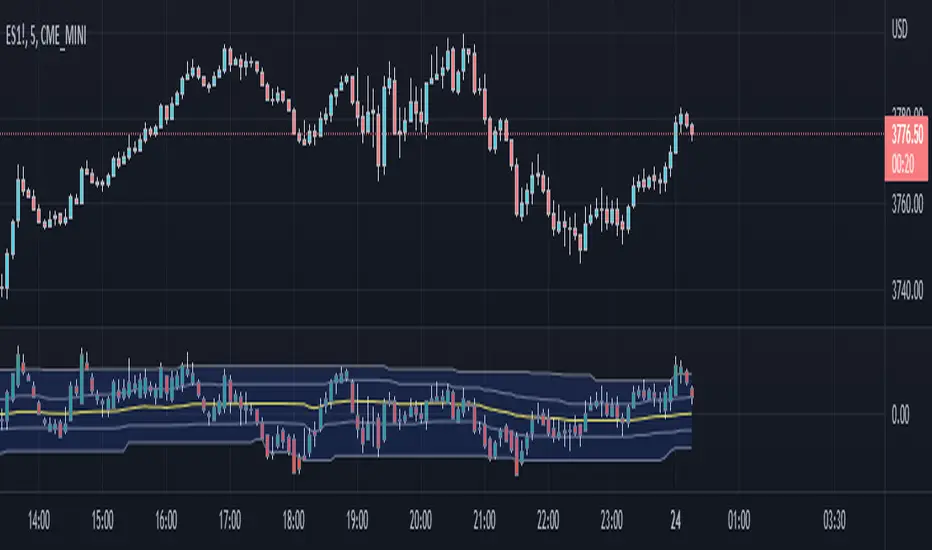
The classic value charts indicator has fixed overbought and oversold levels at 8 and 10 levels and the idea of adding dynamic zones around them instead of fixed levels is appealing.
During the strong trending movements, the overbought and oversold levels also dynamically move up or down.
I have used the dynamic zones code by @allanster.
The idea of using dynamic zones on value charts comes from a similar indicator available in mql4.
During the strong trending movements, the overbought and oversold levels also dynamically move up or down.
I have used the dynamic zones code by @allanster.
The idea of using dynamic zones on value charts comes from a similar indicator available in mql4.
สคริปต์โอเพนซอร์ซ
ด้วยเจตนารมณ์หลักของ TradingView ผู้สร้างสคริปต์นี้ได้ทำให้เป็นโอเพนซอร์ส เพื่อให้เทรดเดอร์สามารถตรวจสอบและยืนยันฟังก์ชันการทำงานของมันได้ ขอชื่นชมผู้เขียน! แม้ว่าคุณจะใช้งานได้ฟรี แต่โปรดจำไว้ว่าการเผยแพร่โค้ดซ้ำจะต้องเป็นไปตาม กฎระเบียบการใช้งาน ของเรา
คำจำกัดสิทธิ์ความรับผิดชอบ
ข้อมูลและบทความไม่ได้มีวัตถุประสงค์เพื่อก่อให้เกิดกิจกรรมทางการเงิน, การลงทุน, การซื้อขาย, ข้อเสนอแนะ หรือคำแนะนำประเภทอื่น ๆ ที่ให้หรือรับรองโดย TradingView อ่านเพิ่มเติมใน ข้อกำหนดการใช้งาน