OPEN-SOURCE SCRIPT
ที่อัปเดต: Relative chart analysis using arithmetic operators
Relative chart analysis using arithmetic operators.
เอกสารเผยแพร่
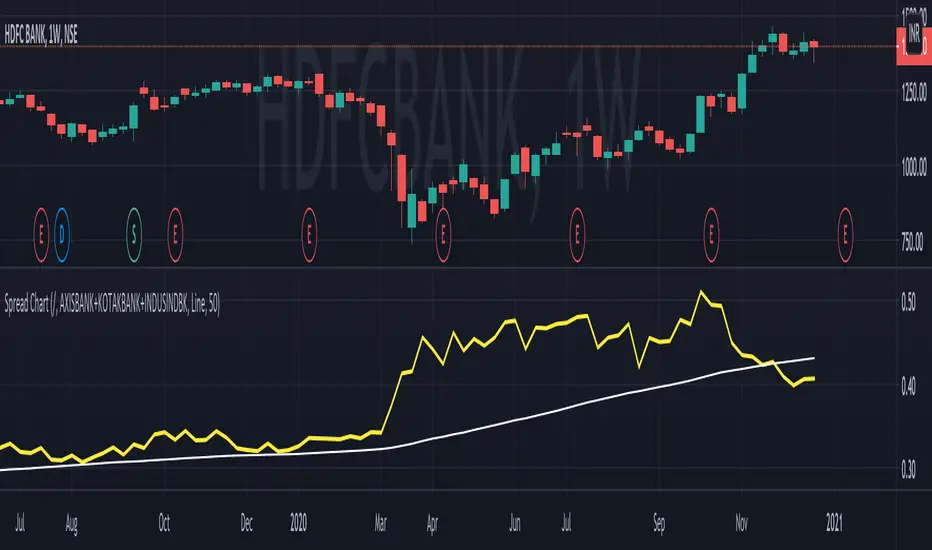
- Now line plots are available and the default option
- The 50 Period Moving Average is also plotted by default
Usage:
On can plot a combination of number of mathematical operators. The input source, can itself also be a combination of different scrips. For example, in this example, we compare (divide / ) HDFCBANK with a "synthetic benchmark" of other competing private banks by combining (AXIS + KOTAK + INDUSIND) in the input.
สคริปต์โอเพนซอร์ซ
ด้วยเจตนารมณ์หลักของ TradingView ผู้สร้างสคริปต์นี้ได้ทำให้เป็นโอเพนซอร์ส เพื่อให้เทรดเดอร์สามารถตรวจสอบและยืนยันฟังก์ชันการทำงานของมันได้ ขอชื่นชมผู้เขียน! แม้ว่าคุณจะใช้งานได้ฟรี แต่โปรดจำไว้ว่าการเผยแพร่โค้ดซ้ำจะต้องเป็นไปตาม กฎระเบียบการใช้งาน ของเรา
คำจำกัดสิทธิ์ความรับผิดชอบ
ข้อมูลและบทความไม่ได้มีวัตถุประสงค์เพื่อก่อให้เกิดกิจกรรมทางการเงิน, การลงทุน, การซื้อขาย, ข้อเสนอแนะ หรือคำแนะนำประเภทอื่น ๆ ที่ให้หรือรับรองโดย TradingView อ่านเพิ่มเติมใน ข้อกำหนดการใช้งาน