OPEN-SOURCE SCRIPT
PumpC Tick Levels Marker
🧾 Description
PumpC Tick Levels Marker
A precision price-level visualization tool designed for futures and tick-based traders.
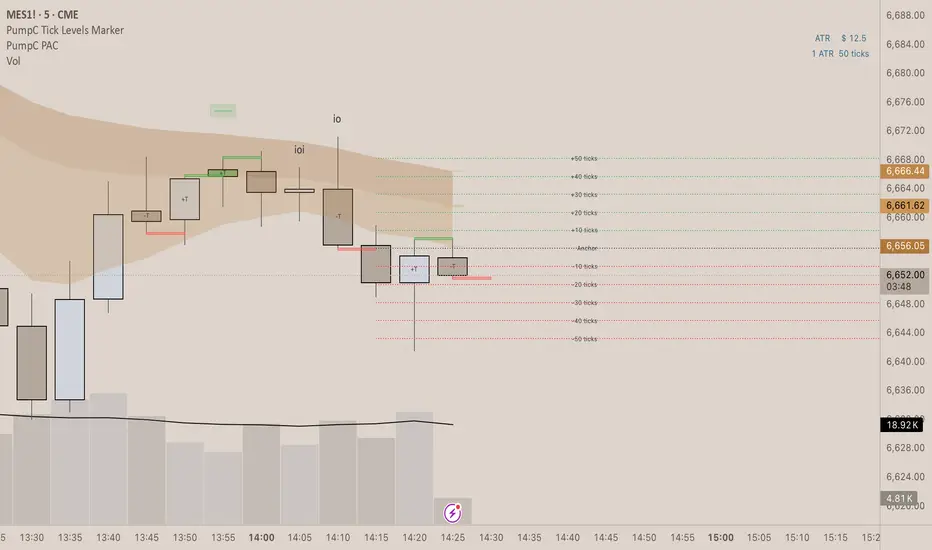
Easily mark a single reference price and automatically plot symmetrical tick levels above and below it.
🔍 How It Works
Select your Anchor Price — this acts as the central reference point.
The script automatically plots upward and downward tick levels spaced by your chosen tick multiple.
Labels display tick distance (+/- ticks) and can be offset to the right by a set number of bars for clean alignment near the price scale.
⚙️ Key Features
One-click anchor control — define a single reference price.
Custom tick spacing — choose your tick multiple and number of levels to show (up to 10 in each direction).
Independent Up/Down toggles — display only the levels you need.
Label offset control — move labels closer or farther from the price scale.
Fully customizable styling — line color, width, and style (solid, dashed, dotted).
Efficient cleanup logic — lines and labels refresh dynamically on update.
🧩 Perfect For
Futures and index traders tracking tick increments (e.g., ES, NQ, CL).
Measuring quick scalp targets or ATR-based micro-ranges.
Visualizing equidistant price steps from a key breakout or reversal point.
Created by: PumpC Trading Tools
Version: 1.0 (Pine Script v6)
License: Open for personal use — please credit “PumpC Tick Levels Marker” if reused or modified.
PumpC Tick Levels Marker
A precision price-level visualization tool designed for futures and tick-based traders.
Easily mark a single reference price and automatically plot symmetrical tick levels above and below it.
🔍 How It Works
Select your Anchor Price — this acts as the central reference point.
The script automatically plots upward and downward tick levels spaced by your chosen tick multiple.
Labels display tick distance (+/- ticks) and can be offset to the right by a set number of bars for clean alignment near the price scale.
⚙️ Key Features
One-click anchor control — define a single reference price.
Custom tick spacing — choose your tick multiple and number of levels to show (up to 10 in each direction).
Independent Up/Down toggles — display only the levels you need.
Label offset control — move labels closer or farther from the price scale.
Fully customizable styling — line color, width, and style (solid, dashed, dotted).
Efficient cleanup logic — lines and labels refresh dynamically on update.
🧩 Perfect For
Futures and index traders tracking tick increments (e.g., ES, NQ, CL).
Measuring quick scalp targets or ATR-based micro-ranges.
Visualizing equidistant price steps from a key breakout or reversal point.
Created by: PumpC Trading Tools
Version: 1.0 (Pine Script v6)
License: Open for personal use — please credit “PumpC Tick Levels Marker” if reused or modified.
สคริปต์โอเพนซอร์ซ
ด้วยเจตนารมณ์หลักของ TradingView ผู้สร้างสคริปต์นี้ได้ทำให้เป็นโอเพนซอร์ส เพื่อให้เทรดเดอร์สามารถตรวจสอบและยืนยันฟังก์ชันการทำงานของมันได้ ขอชื่นชมผู้เขียน! แม้ว่าคุณจะใช้งานได้ฟรี แต่โปรดจำไว้ว่าการเผยแพร่โค้ดซ้ำจะต้องเป็นไปตาม กฎระเบียบการใช้งาน ของเรา
คำจำกัดสิทธิ์ความรับผิดชอบ
ข้อมูลและบทความไม่ได้มีวัตถุประสงค์เพื่อก่อให้เกิดกิจกรรมทางการเงิน, การลงทุน, การซื้อขาย, ข้อเสนอแนะ หรือคำแนะนำประเภทอื่น ๆ ที่ให้หรือรับรองโดย TradingView อ่านเพิ่มเติมใน ข้อกำหนดการใช้งาน