OPEN-SOURCE SCRIPT
ที่อัปเดต: Overlay Candles (Multi-TF, right side projection)

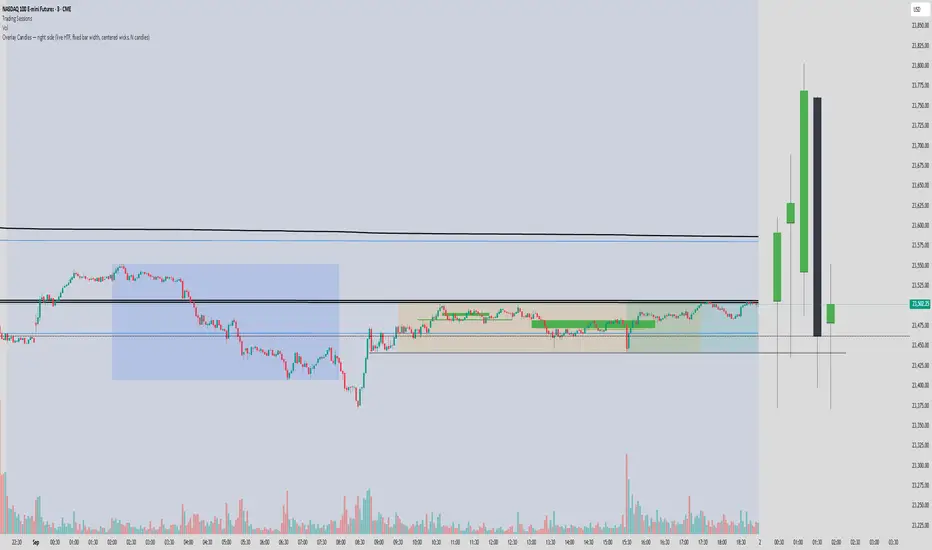
This script overlays candles from a custom selectable timeframe (5m to 1M) on the right side of the chart as projections.
It helps visualize and compare the ongoing price action with the last higher-timeframe candles without switching chart intervals.
Features:
Choose timeframe for overlay candles (5m, 15m, 1H, 4H, 1D, 1W, 1M).
Adjustable number of candles to display (1–8).
Fixed candle width (in bars) and configurable gap between candles.
Custom colors for bullish and bearish candles.
Adjustable wick and border thickness (px).
Candle borders drawn with four lines to ensure visibility at all zoom levels.
Use cases:
Multi-timeframe price action analysis.
Visualizing higher-timeframe structure alongside lower-timeframe trading.
Educational / visual aid for understanding candlestick context.
เอกสารเผยแพร่
This script overlays candles from a custom selectable timeframe (5m to 1M) on the right side of the chart as projections.It helps visualize and compare the ongoing price action with the last higher-timeframe candles without switching chart intervals.
Features:
Choose timeframe for overlay candles (5m, 15m, 1H, 4H, 1D, 1W, 1M).
Adjustable number of candles to display (1–8).
Fixed candle width (in bars) and configurable gap between candles.
Custom colors for bullish and bearish candles.
Adjustable wick and border thickness (px).
Candle borders drawn with four lines to ensure visibility at all zoom levels.
Use cases:
Multi-timeframe price action analysis.
Visualizing higher-timeframe structure alongside lower-timeframe trading.
Educational / visual aid for understanding candlestick context.
สคริปต์โอเพนซอร์ซ
ด้วยเจตนารมณ์หลักของ TradingView ผู้สร้างสคริปต์นี้ได้ทำให้เป็นโอเพนซอร์ส เพื่อให้เทรดเดอร์สามารถตรวจสอบและยืนยันฟังก์ชันการทำงานของมันได้ ขอชื่นชมผู้เขียน! แม้ว่าคุณจะใช้งานได้ฟรี แต่โปรดจำไว้ว่าการเผยแพร่โค้ดซ้ำจะต้องเป็นไปตาม กฎระเบียบการใช้งาน ของเรา
คำจำกัดสิทธิ์ความรับผิดชอบ
ข้อมูลและบทความไม่ได้มีวัตถุประสงค์เพื่อก่อให้เกิดกิจกรรมทางการเงิน, การลงทุน, การซื้อขาย, ข้อเสนอแนะ หรือคำแนะนำประเภทอื่น ๆ ที่ให้หรือรับรองโดย TradingView อ่านเพิ่มเติมใน ข้อกำหนดการใช้งาน