OPEN-SOURCE SCRIPT
Fractal Dimension Index (FDI) by CoryP1990 – Quant Toolkit
The Fractal Dimension Index (FDI) quantifies how directional or choppy price movement is; in other words, it measures the “roughness” of a trend. FDI values near 1.0–1.3 indicate strong directional trends, while values near 1.5–2.0 reflect chaotic or range-bound behavior. This makes FDI a powerful tool for detecting trend vs. mean-reversion regimes.
How it works
Calculates the ratio of average price changes over full and half-length windows to estimate the fractal dimension of price movement.
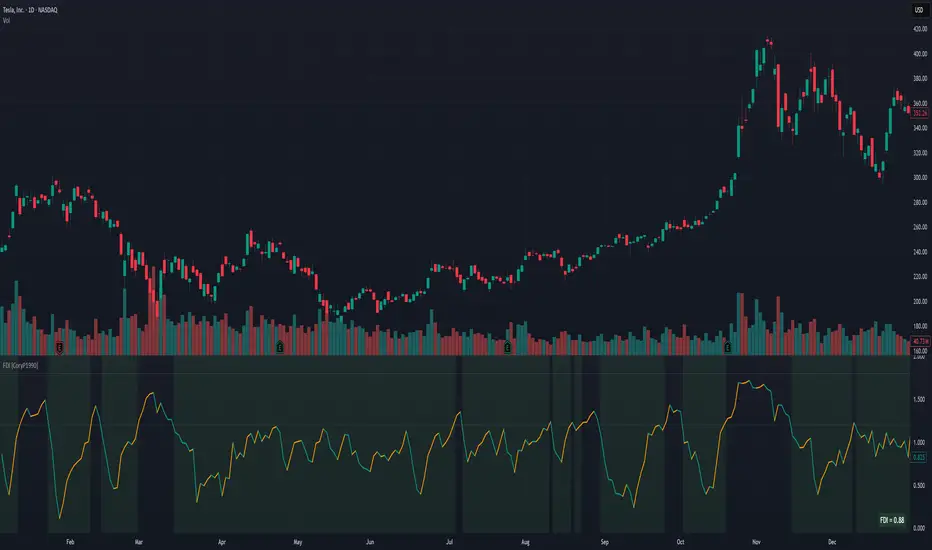
Teal line = FDI decreasing → trending behavior (market smoother, more directional).
Orange line = FDI increasing → choppiness or consolidation.
Background:
Green tint = trend-friendly regime (FDI below low threshold).
Orange tint = choppy regime (FDI above high threshold).
Use cases
Detect when markets shift from trend-following to mean-reverting conditions.
Filter trades: favor trend strategies when FDI < 1.3 and reversion setups when FDI > 1.7.
Combine with momentum or volatility metrics to classify regimes.
Defaults
Length = 20
High-FDI threshold = 1.8
Low-FDI threshold = 1.2
Example — TSLA (1D, 2021)
Early 2021 trades choppy to sideways with FDI swinging up toward 1.5, then the index drops below 1.2 as Tesla transitions into a persistent trend-friendly regime through the second half of the year (green background). During the Q4 breakout, FDI holds ~1.0–1.2, confirming strong directionality; brief pullbacks lift FDI back toward the mid-range before trending pressure resumes. At the right edge, FDI sits well below the low threshold, signaling that price remains in a trend-supportive state.
Part of the Quant Toolkit — transparent, open-source indicators for modern quantitative analysis. Built by CoryP1990.
How it works
Calculates the ratio of average price changes over full and half-length windows to estimate the fractal dimension of price movement.
Teal line = FDI decreasing → trending behavior (market smoother, more directional).
Orange line = FDI increasing → choppiness or consolidation.
Background:
Green tint = trend-friendly regime (FDI below low threshold).
Orange tint = choppy regime (FDI above high threshold).
Use cases
Detect when markets shift from trend-following to mean-reverting conditions.
Filter trades: favor trend strategies when FDI < 1.3 and reversion setups when FDI > 1.7.
Combine with momentum or volatility metrics to classify regimes.
Defaults
Length = 20
High-FDI threshold = 1.8
Low-FDI threshold = 1.2
Example — TSLA (1D, 2021)
Early 2021 trades choppy to sideways with FDI swinging up toward 1.5, then the index drops below 1.2 as Tesla transitions into a persistent trend-friendly regime through the second half of the year (green background). During the Q4 breakout, FDI holds ~1.0–1.2, confirming strong directionality; brief pullbacks lift FDI back toward the mid-range before trending pressure resumes. At the right edge, FDI sits well below the low threshold, signaling that price remains in a trend-supportive state.
Part of the Quant Toolkit — transparent, open-source indicators for modern quantitative analysis. Built by CoryP1990.
สคริปต์โอเพนซอร์ซ
ด้วยเจตนารมณ์หลักของ TradingView ผู้สร้างสคริปต์นี้ได้ทำให้มันเป็นโอเพ่นซอร์ส เพื่อให้เทรดเดอร์สามารถตรวจสอบและยืนยันการทำงานของสคริปต์ได้ ขอแสดงความชื่นชมผู้เขียน! แม้ว่าคุณจะสามารถใช้งานได้ฟรี แต่อย่าลืมว่าการเผยแพร่โค้ดซ้ำนั้นจะต้องเป็นไปตามกฎระเบียบการใช้งานของเรา
Quant finance researcher focused on options, volatility modeling, and derivative pricing. Building tools that turn complex market behavior into clear, data-driven insights. Explore analytics and modeling at OptionsAnalysisSuite.com
คำจำกัดสิทธิ์ความรับผิดชอบ
ข้อมูลและบทความไม่ได้มีวัตถุประสงค์เพื่อก่อให้เกิดกิจกรรมทางการเงิน, การลงทุน, การซื้อขาย, ข้อเสนอแนะ หรือคำแนะนำประเภทอื่น ๆ ที่ให้หรือรับรองโดย TradingView อ่านเพิ่มเติมที่ ข้อกำหนดการใช้งาน