OPEN-SOURCE SCRIPT
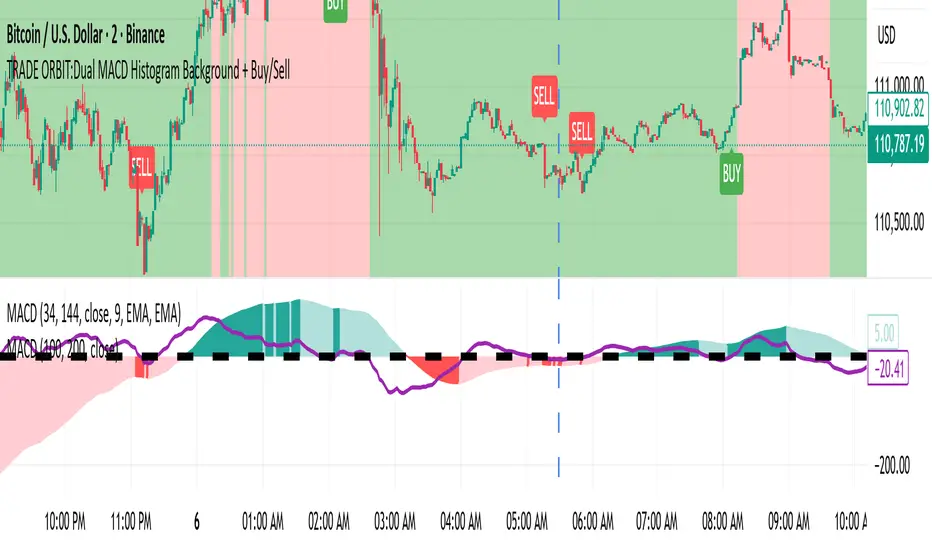
TRADE ORBIT:Dual MACD Histogram Background + Buy/Sell
Description:
This indicator combines two MACD systems to provide clear trend, buy/sell signals, and identifies potential discount and premium zones for smarter entries and exits.
Features:
MACD #1 (100, 200, 50) – Trend & Background Coloring
Histogram > 0 → Green background (Bullish trend)
Histogram < 0 → Red background (Bearish trend)
MACD #2 (34, 144, 9) – Buy/Sell Signals
Buy Signal: Histogram crosses above zero and MACD #1 background is green
Sell Signal: Histogram crosses below zero and MACD #1 background is red
Signals are plotted as tiny labels directly on the chart
Discount & Premium Zones
Discount Zone: Price below MACD #1 slow EMA → highlighted in green
Premium Zone: Price above MACD #1 slow EMA → highlighted in red
Helps identify “cheap” (potential buy) and “expensive” (potential sell) areas relative to trend
Reference Plots (Optional)
MACD #1 & #2 histograms plotted as columns for visual confirmation
Usage:
Use MACD #1 background to identify the prevailing trend.
Wait for MACD #2 cross signals aligned with trend for buy/sell confirmation.
Discount and premium zones help time entries and exits more efficiently.
Ideal For:
Swing traders and position traders who want to combine trend-following signals with overbought/oversold zones.
สคริปต์โอเพนซอร์ซ
ด้วยเจตนารมณ์หลักของ TradingView ผู้สร้างสคริปต์นี้ได้ทำให้มันเป็นโอเพ่นซอร์ส เพื่อให้เทรดเดอร์สามารถตรวจสอบและยืนยันการทำงานของสคริปต์ได้ ขอแสดงความชื่นชมผู้เขียน! แม้ว่าคุณจะสามารถใช้งานได้ฟรี แต่อย่าลืมว่าการเผยแพร่โค้ดซ้ำนั้นจะต้องเป็นไปตามกฎระเบียบการใช้งานของเรา
คำจำกัดสิทธิ์ความรับผิดชอบ
ข้อมูลและบทความไม่ได้มีวัตถุประสงค์เพื่อก่อให้เกิดกิจกรรมทางการเงิน, การลงทุน, การซื้อขาย, ข้อเสนอแนะ หรือคำแนะนำประเภทอื่น ๆ ที่ให้หรือรับรองโดย TradingView อ่านเพิ่มเติมที่ ข้อกำหนดการใช้งาน