OPEN-SOURCE SCRIPT
ที่อัปเดต: Levels
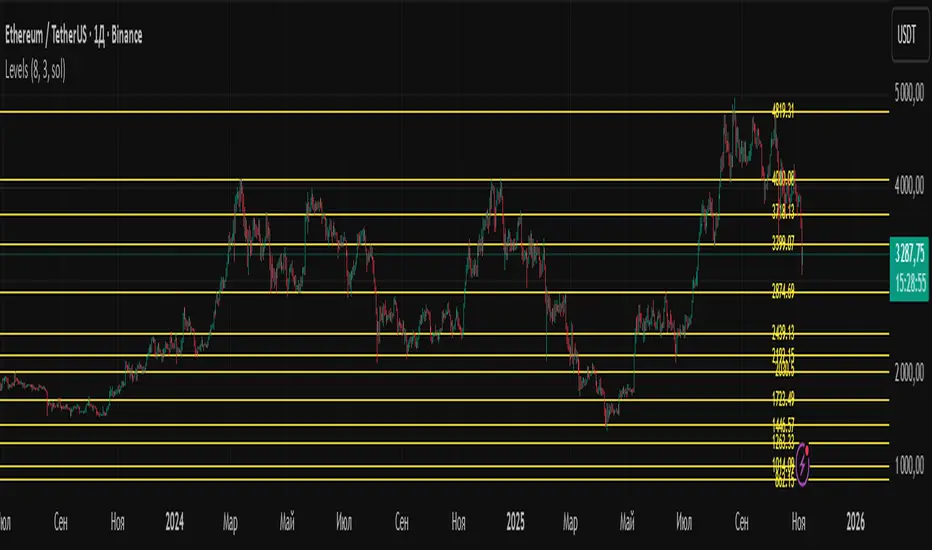
Levels is a powerful technical analysis tool that automatically identifies and displays key support and resistance levels on the chart. The indicator analyzes historical price data, detecting significant price levels where multiple reversals or price stops have occurred.
How the Indicator Works?
1. Identification of Reversal Points:
- The indicator tracks price extremes using an algorithm to identify local highs and lows
- A reversal point is recorded when:
- Uptrend: price reaches a new low for the last 10 bars
- Downtrend: price reaches a new high for the last 10 bars
2. Level Grouping:
- All found reversal points are analyzed and grouped into key levels
- Levels are combined if they fall within the specified percentage tolerance
3. Filtering Significant Levels:
- Only levels that have been tested the minimum number of times (set in settings) are preserved
- This ensures only statistically significant levels are displayed
How to Use the Indicator?
Trading Scenarios:
1. Bounce from Level:
- When price approaches an identified level, a bounce can be expected
- Opening positions on the bounce with protective stop-loss beyond the level
2. Level Breakout:
- Breaking through a key level may signal trend continuation
- Support level becomes resistance and vice versa
3. Consolidation near Level:
- Prolonged price presence near a level indicates its significance
- Strong movement can be expected after exiting consolidation
Advantages:
- Automatic level identification eliminates subjectivity
- Sensitivity customization for different timeframes and instruments
- Visual simplicity - only significant levels
Indicator Settings
Main Parameters:
- Show Key Levels - enable/disable level display
- Level Tolerance (%) - percentage tolerance for level grouping
- Smaller values: more levels, more precise
- Larger values: fewer levels, more significant
- Minimum Touches - minimum number of touches to form a level
Visual Settings:
- Level Color - level display color
- Level Style - line style (solid, dashed, dotted)
Limitations
- Levels are built only on available historical data
- Does not account for trading volumes
- Parameter adjustment may be required during high volatility periods
The indicator is particularly effective when combined with other analysis tools for signal confirmation.
เอกสารเผยแพร่
new levelsสคริปต์โอเพนซอร์ซ
ด้วยเจตนารมณ์หลักของ TradingView ผู้สร้างสคริปต์นี้ได้ทำให้เป็นโอเพนซอร์ส เพื่อให้เทรดเดอร์สามารถตรวจสอบและยืนยันฟังก์ชันการทำงานของมันได้ ขอชื่นชมผู้เขียน! แม้ว่าคุณจะใช้งานได้ฟรี แต่โปรดจำไว้ว่าการเผยแพร่โค้ดซ้ำจะต้องเป็นไปตาม กฎระเบียบการใช้งาน ของเรา
💡 Обсуждаем торговые идеи , делимся индикаторами и стратегиями в нашем Telegram-чате:
👉 t.me/+AQWwxRhhrXI0YTgy
👉 t.me/+AQWwxRhhrXI0YTgy
คำจำกัดสิทธิ์ความรับผิดชอบ
ข้อมูลและบทความไม่ได้มีวัตถุประสงค์เพื่อก่อให้เกิดกิจกรรมทางการเงิน, การลงทุน, การซื้อขาย, ข้อเสนอแนะ หรือคำแนะนำประเภทอื่น ๆ ที่ให้หรือรับรองโดย TradingView อ่านเพิ่มเติมใน ข้อกำหนดการใช้งาน
สคริปต์โอเพนซอร์ซ
ด้วยเจตนารมณ์หลักของ TradingView ผู้สร้างสคริปต์นี้ได้ทำให้เป็นโอเพนซอร์ส เพื่อให้เทรดเดอร์สามารถตรวจสอบและยืนยันฟังก์ชันการทำงานของมันได้ ขอชื่นชมผู้เขียน! แม้ว่าคุณจะใช้งานได้ฟรี แต่โปรดจำไว้ว่าการเผยแพร่โค้ดซ้ำจะต้องเป็นไปตาม กฎระเบียบการใช้งาน ของเรา
💡 Обсуждаем торговые идеи , делимся индикаторами и стратегиями в нашем Telegram-чате:
👉 t.me/+AQWwxRhhrXI0YTgy
👉 t.me/+AQWwxRhhrXI0YTgy
คำจำกัดสิทธิ์ความรับผิดชอบ
ข้อมูลและบทความไม่ได้มีวัตถุประสงค์เพื่อก่อให้เกิดกิจกรรมทางการเงิน, การลงทุน, การซื้อขาย, ข้อเสนอแนะ หรือคำแนะนำประเภทอื่น ๆ ที่ให้หรือรับรองโดย TradingView อ่านเพิ่มเติมใน ข้อกำหนดการใช้งาน