INVITE-ONLY SCRIPT
Skynet PA osc
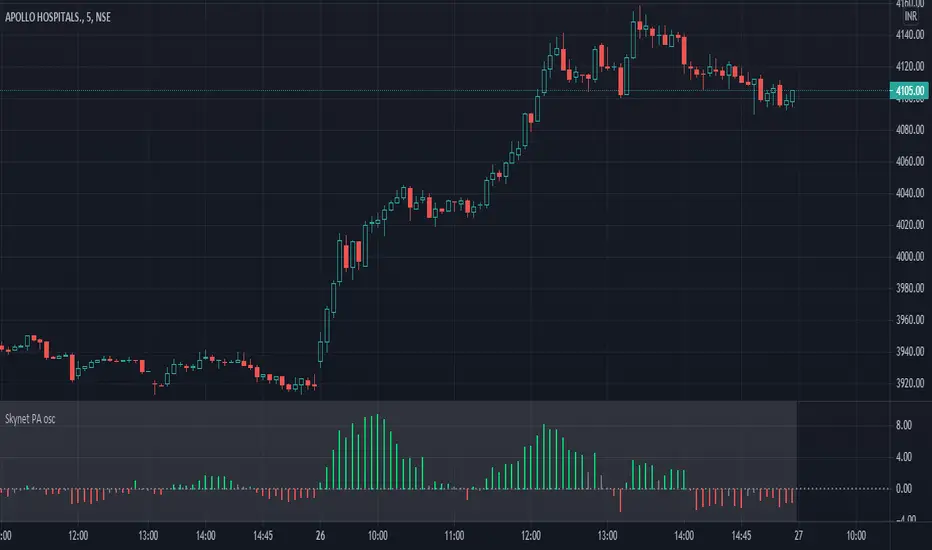
The Skynet PA osc has the following features :
1>>> Oscillator : The oscillator represents the rate of change of close price for the past 20 candles.
1.a> Bullish signal : When the oscillator turns green/lime color, it indicates that the price is gaining momentum on the upside.
1.b> Bearish signal : When the oscillator turns red, it indicates that the price is gaining momentum on the downside.
2>>> Entry/exit points :
2.a>Strong bullish: When an aqua/blue color diamond appears, it indicates a strong bullish momentum for the price.
2.b>Strong bearish : When a pink/purple color diamond appears on the zero line, it indicates a strong bearish momentum for the price.
**** Volume along with the oscillator is used to generate the diamond labels.
Disclaimer: This indicator is not 100% accurate and false signals are generated from time to time. Trading in the markets involves huge risks and one should always do his/her own research before making any trading decisions. This indicator is only designed to help you make a trading decision.
สคริปต์เฉพาะผู้ได้รับเชิญเท่านั้น
การเข้าถึงสคริปต์นี้จำกัดเฉพาะผู้ใช้ที่ได้รับอนุญาตจากผู้เขียน และมักจะต้องชำระเงินก่อน คุณสามารถเพิ่มลงในรายการโปรดของคุณได้ แต่คุณจะสามารถใช้งานได้หลังจากขออนุญาตและขอรับจากผู้เขียนเท่านั้น ติดต่อ skynet970 สำหรับข้อมูลเพิ่มเติม หรือทำตามคำแนะนำของผู้เขียนด้านล่าง
TradingView ไม่แนะนำให้ชำระเงินสำหรับการซื้อสคริปต์และไม่แนะนำให้ใช้งานสคริปต์นั้นๆ จนกว่าคุณจะเชื่อมั่นในผู้เขียนสคริปต์ 100% และเข้าใจว่าสคริปต์ทำงานอย่างไร ในกรณีอื่นๆ คุณสามารถหาทางเลือกโอเพนซอร์สที่ดีได้ฟรีใน สคริปต์ชุมชน ของเรา
คำแนะนำของผู้เขียน
″You can get this indicator by leaving me a private message on tradingview.
ต้องการที่จะใช้สคริปต์นี้บนชาร์ตใช่ไหม?
คำเตือน: กรุณาอ่าน ก่อนร้องขอการเข้าถึง
คำจำกัดสิทธิ์ความรับผิดชอบ
ข้อมูลและบทความไม่ได้มีวัตถุประสงค์เพื่อก่อให้เกิดกิจกรรมทางการเงิน, การลงทุน, การซื้อขาย, ข้อเสนอแนะ หรือคำแนะนำประเภทอื่น ๆ ที่ให้หรือรับรองโดย TradingView อ่านเพิ่มเติมที่ ข้อกำหนดการใช้งาน