OPEN-SOURCE SCRIPT
ที่อัปเดต: Market Structure (Nephew_Sam_)

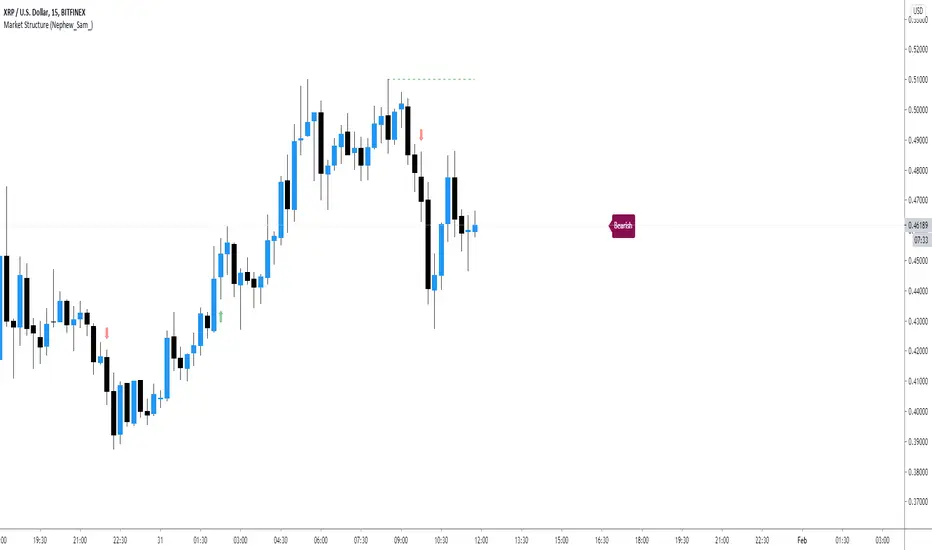
This indicator consists of 3 features:
1. Plots label to the right for current market structure
2. Plots dashed line to show where the next market structure would be
3. Draws arrows above/below historical market structure breaks
This might get a little to noisy in ranging markets or lower timeframes but it does the job.
Credits to SimpleCryptoLife for the source code.
This script is take from the indicator "True Market Structure" which is created by the above mentioned user
Copyright rules for reusing the script:
// == COPYRIGHT ==
// Script by @SimpleCrpytoLife. This script is open-source.
// --> If you use ideas from it, you don't need to ask or give credit to me.
// --> If you copy code out of here to adapt for your own script, it must be open-source. You don't need to ask permission, just credit @SimpleCryptoLife.
เอกสารเผยแพร่
Added multiple timeframes labelเอกสารเผยแพร่
Reverted new update, too many bugs.สคริปต์โอเพนซอร์ซ
ด้วยเจตนารมณ์หลักของ TradingView ผู้สร้างสคริปต์นี้ได้ทำให้เป็นโอเพนซอร์ส เพื่อให้เทรดเดอร์สามารถตรวจสอบและยืนยันฟังก์ชันการทำงานของมันได้ ขอชื่นชมผู้เขียน! แม้ว่าคุณจะใช้งานได้ฟรี แต่โปรดจำไว้ว่าการเผยแพร่โค้ดซ้ำจะต้องเป็นไปตาม กฎระเบียบการใช้งาน ของเรา
คำจำกัดสิทธิ์ความรับผิดชอบ
ข้อมูลและบทความไม่ได้มีวัตถุประสงค์เพื่อก่อให้เกิดกิจกรรมทางการเงิน, การลงทุน, การซื้อขาย, ข้อเสนอแนะ หรือคำแนะนำประเภทอื่น ๆ ที่ให้หรือรับรองโดย TradingView อ่านเพิ่มเติมใน ข้อกำหนดการใช้งาน
สคริปต์โอเพนซอร์ซ
ด้วยเจตนารมณ์หลักของ TradingView ผู้สร้างสคริปต์นี้ได้ทำให้เป็นโอเพนซอร์ส เพื่อให้เทรดเดอร์สามารถตรวจสอบและยืนยันฟังก์ชันการทำงานของมันได้ ขอชื่นชมผู้เขียน! แม้ว่าคุณจะใช้งานได้ฟรี แต่โปรดจำไว้ว่าการเผยแพร่โค้ดซ้ำจะต้องเป็นไปตาม กฎระเบียบการใช้งาน ของเรา
คำจำกัดสิทธิ์ความรับผิดชอบ
ข้อมูลและบทความไม่ได้มีวัตถุประสงค์เพื่อก่อให้เกิดกิจกรรมทางการเงิน, การลงทุน, การซื้อขาย, ข้อเสนอแนะ หรือคำแนะนำประเภทอื่น ๆ ที่ให้หรือรับรองโดย TradingView อ่านเพิ่มเติมใน ข้อกำหนดการใช้งาน