Stock Crash Risk (SCR)
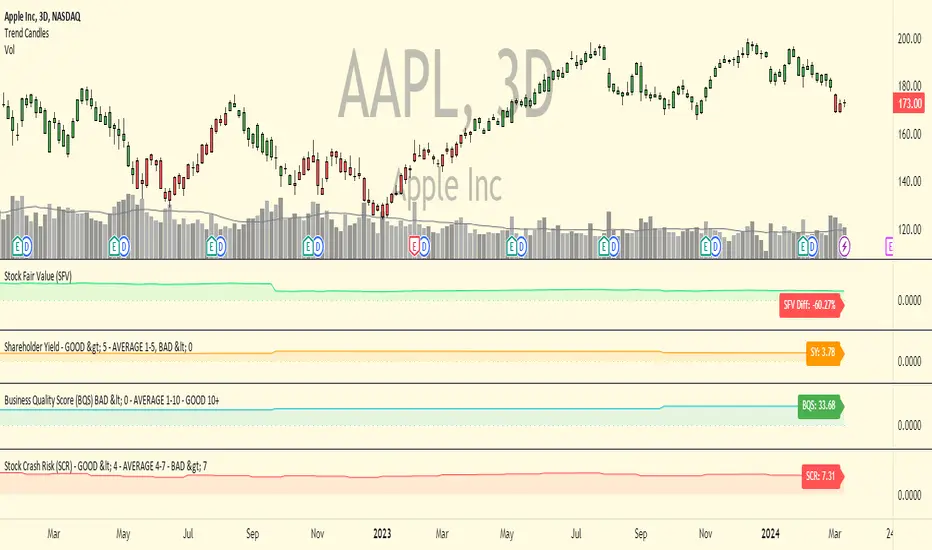
The indicator uses both price action and fundamental valuation metrics to calculate the reading. Generally speaking, when a stock price exhibits both extreme price sentiment and valuation it's likely to crash at some point. This indicator can also be used for the opposite use, meaning when it has a low reading under 3 it could be a good time to buy since both price and valuation are low.
This indicator is best used on stocks on the daily, weekly and monthly timeframes. It's value will always be the same regardless of what timeframe is used. Since it uses stock valuation this indicator cannot be used on other markets like forex, futures or crypto.
In the chart above you can see it applied to Peloton
Below is another example of Zoom Video
Here's another example with Upstart
To get access to this indicator PM or email me to my address shown below.
Enjoy :)
Disclaimer: All my scripts and content are for educational purposes only. I'm not a financial advisor and do not give personal finance advice. Past performance is no guarantee of future performance. Please trade at your own risk.
สคริปต์แบบเฉพาะผู้ได้รับเชิญเท่านั้น
เฉพาะผู้ใช้งานที่ผู้เขียนอนุมัตเท่านั้นจึงจะสามารถเข้าถึงสคริปต์นี้ได้ คุณจะต้องขอและได้รับอนุญาตก่อนใช้งาน ซึ่งโดยทั่วไปจะได้รับอนุญาตหลังจากชำระเงินแล้ว สำหรับรายละเอียดเพิ่มเติม โปรดทำตามคำแนะนำของผู้เขียนด้านล่าง หรือติดต่อ Click-Capital โดยตรง
TradingView ไม่แนะนำให้จ่ายเงินหรือใช้สคริปต์ เว้นแต่คุณจะเชื่อถือผู้เขียนและเข้าใจวิธีการทำงานของสคริปต์นั้นอย่างถ่องแท้ คุณยังสามารถหาทางเลือกแบบโอเพนซอร์สฟรีได้ใน สคริปต์ชุมชนของเรา
คำแนะนำของผู้เขียน
คำจำกัดสิทธิ์ความรับผิดชอบ
สคริปต์แบบเฉพาะผู้ได้รับเชิญเท่านั้น
เฉพาะผู้ใช้งานที่ผู้เขียนอนุมัตเท่านั้นจึงจะสามารถเข้าถึงสคริปต์นี้ได้ คุณจะต้องขอและได้รับอนุญาตก่อนใช้งาน ซึ่งโดยทั่วไปจะได้รับอนุญาตหลังจากชำระเงินแล้ว สำหรับรายละเอียดเพิ่มเติม โปรดทำตามคำแนะนำของผู้เขียนด้านล่าง หรือติดต่อ Click-Capital โดยตรง
TradingView ไม่แนะนำให้จ่ายเงินหรือใช้สคริปต์ เว้นแต่คุณจะเชื่อถือผู้เขียนและเข้าใจวิธีการทำงานของสคริปต์นั้นอย่างถ่องแท้ คุณยังสามารถหาทางเลือกแบบโอเพนซอร์สฟรีได้ใน สคริปต์ชุมชนของเรา