OPEN-SOURCE SCRIPT
Long Short dom
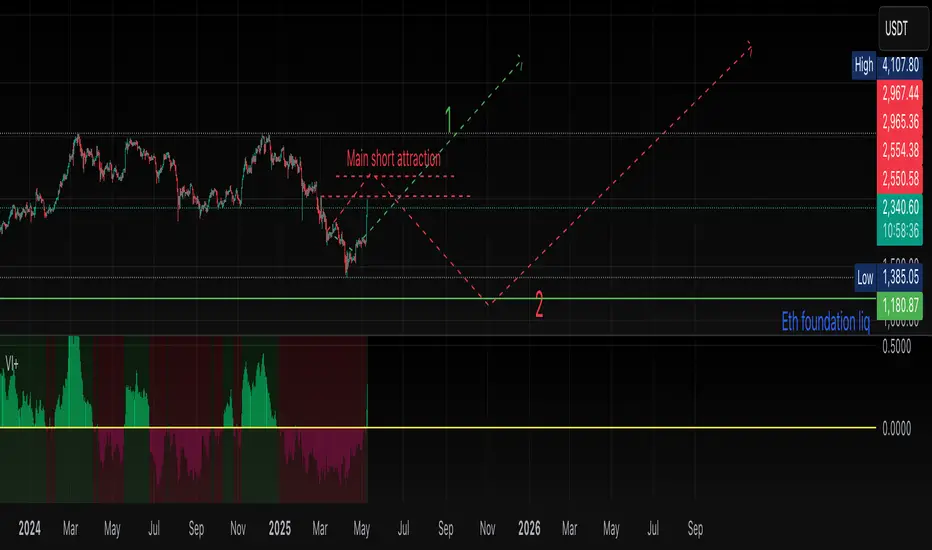
📊 Long Short dom (VI+) — Custom Vortex Trend Strength Indicator
This indicator is a refined version of the Vortex Indicator (VI) designed to help traders identify trend direction, momentum dominance, and potential long/short opportunities based on VI+ and VI– dynamics.
🔍 What It Shows:
• VI+ (Green Line): Measures upward trend strength.
• VI– (Red Line): Measures downward trend strength.
• Histogram (optional): Displays the difference between VI+ and VI–, helping visualize which side is dominant.
• Background Coloring: Highlights bullish or bearish dominance zones.
• Zero Line: A visual baseline to enhance clarity.
• Highest/Lowest Active Lines: Real-time markers for the strongest directional signals.
⸻
🛠️ Inputs:
• Length: Vortex calculation period (default 14).
• Show Histogram: Enable/disable VI+–VI– difference bars.
• Show Trend Background: Toggle colored zones showing trend dominance.
• Show Below Zero: Decide whether to display values that fall below 0 (for advanced use).
⸻
📈 Strategy Insights:
• When VI+ crosses above VI–, it indicates potential long momentum.
• When VI+ crosses below VI–, it signals possible short pressure.
• The delta histogram (VI+ – VI–) helps you quickly see shifts in momentum strength.
• The background shading provides an intuitive visual cue to assess trend dominance at a glance.
⸻
🚨 Built-in Alerts:
• Bullish Cross: VI+ crosses above VI– → possible entry long.
• Bearish Cross: VI+ crosses below VI– → possible entry short.
⸻
✅ Ideal For:
• Trend-following strategies
• Identifying long/short bias
• Confirming entries/exits with momentum analysis
⸻
This tool gives you clean, real-time visual insight into trend strength and shift dynamics, empowering smarter trade decisions with clarity and confidence.
สคริปต์โอเพนซอร์ซ
ด้วยเจตนารมณ์หลักของ TradingView ผู้สร้างสคริปต์นี้ได้ทำให้เป็นโอเพนซอร์ส เพื่อให้เทรดเดอร์สามารถตรวจสอบและยืนยันฟังก์ชันการทำงานของมันได้ ขอชื่นชมผู้เขียน! แม้ว่าคุณจะใช้งานได้ฟรี แต่โปรดจำไว้ว่าการเผยแพร่โค้ดซ้ำจะต้องเป็นไปตาม กฎระเบียบการใช้งาน ของเรา
คำจำกัดสิทธิ์ความรับผิดชอบ
ข้อมูลและบทความไม่ได้มีวัตถุประสงค์เพื่อก่อให้เกิดกิจกรรมทางการเงิน, การลงทุน, การซื้อขาย, ข้อเสนอแนะ หรือคำแนะนำประเภทอื่น ๆ ที่ให้หรือรับรองโดย TradingView อ่านเพิ่มเติมใน ข้อกำหนดการใช้งาน