OPEN-SOURCE SCRIPT
ที่อัปเดต: Purple Cloud
The above lines calculate several intermediate values used in the indicator's calculations. Here's a breakdown of each variable:
a1: Represents a modified Exponential Moving Average (EMA) of the high price series, subtracted by a Simple Moving Average (SMA) of the low price series.
a2: Takes the square root of the lowest value between the highest close price over the last 200 bars and the current close price, multiplied by a1.
b1: Represents a modified EMA of the low price series, subtracted by an SMA of the high price series.
b2: Takes the square root of the highest value between the lowest close price over the last 200 bars and the current close price, multiplied by b1.
c1: Represents the square root of a2 multiplied by b2.
These lines create multiple plots using the plot function. Each plot represents a displaced version of c1 by a certain multiple of the Average True Range (ATR) multiplied by a constant factor (0.1, 0.2, 0.3, etc.). The transparency (transp) is set to 100 for all plots.
เอกสารเผยแพร่
Add Alpha เอกสารเผยแพร่
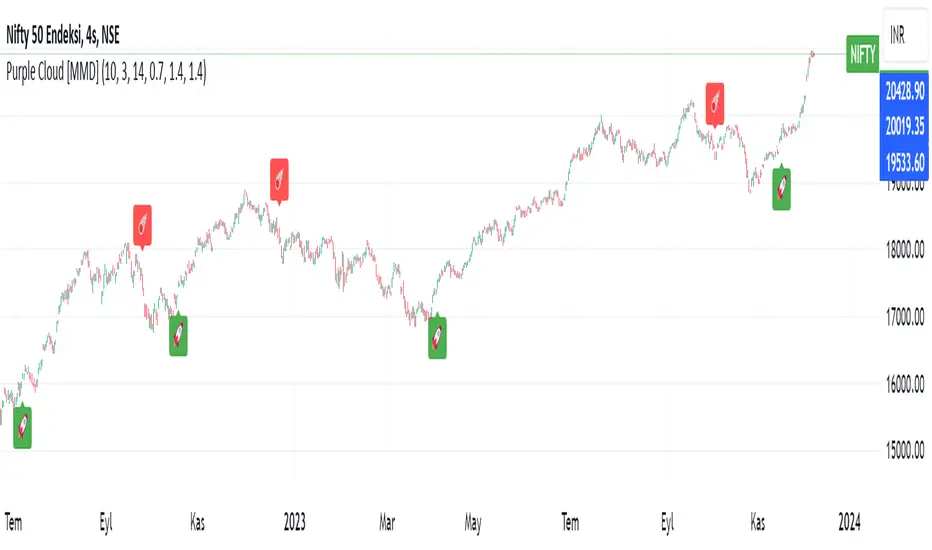
Added Pink Green Yellow bar.Green Bar--->Buy
Pink Bar--->Sell
Yellow Bar--->Unstable
เอกสารเผยแพร่
I added Maybe Pump Maybe Dumpเอกสารเผยแพร่
Added Rsi Background Colorเอกสารเผยแพร่
Deleted Cloudsเอกสารเผยแพร่
Added Bomb Pump Dumpเอกสารเผยแพร่
Changed Allเอกสารเผยแพร่
Change Nameเอกสารเผยแพร่
added alert and funcsเอกสารเผยแพร่
Added colourเอกสารเผยแพร่
Added MMD Bandsเอกสารเผยแพร่
Added Supertrend and Ema 200 50 20เอกสารเผยแพร่
Added Buying Pressure Threshold % and Selling Pressure Threshold % and changed formulaสคริปต์โอเพนซอร์ซ
ด้วยเจตนารมณ์หลักของ TradingView ผู้สร้างสคริปต์นี้ได้ทำให้เป็นโอเพนซอร์ส เพื่อให้เทรดเดอร์สามารถตรวจสอบและยืนยันฟังก์ชันการทำงานของมันได้ ขอชื่นชมผู้เขียน! แม้ว่าคุณจะใช้งานได้ฟรี แต่โปรดจำไว้ว่าการเผยแพร่โค้ดซ้ำจะต้องเป็นไปตาม กฎระเบียบการใช้งาน ของเรา
คำจำกัดสิทธิ์ความรับผิดชอบ
ข้อมูลและบทความไม่ได้มีวัตถุประสงค์เพื่อก่อให้เกิดกิจกรรมทางการเงิน, การลงทุน, การซื้อขาย, ข้อเสนอแนะ หรือคำแนะนำประเภทอื่น ๆ ที่ให้หรือรับรองโดย TradingView อ่านเพิ่มเติมใน ข้อกำหนดการใช้งาน
สคริปต์โอเพนซอร์ซ
ด้วยเจตนารมณ์หลักของ TradingView ผู้สร้างสคริปต์นี้ได้ทำให้เป็นโอเพนซอร์ส เพื่อให้เทรดเดอร์สามารถตรวจสอบและยืนยันฟังก์ชันการทำงานของมันได้ ขอชื่นชมผู้เขียน! แม้ว่าคุณจะใช้งานได้ฟรี แต่โปรดจำไว้ว่าการเผยแพร่โค้ดซ้ำจะต้องเป็นไปตาม กฎระเบียบการใช้งาน ของเรา
คำจำกัดสิทธิ์ความรับผิดชอบ
ข้อมูลและบทความไม่ได้มีวัตถุประสงค์เพื่อก่อให้เกิดกิจกรรมทางการเงิน, การลงทุน, การซื้อขาย, ข้อเสนอแนะ หรือคำแนะนำประเภทอื่น ๆ ที่ให้หรือรับรองโดย TradingView อ่านเพิ่มเติมใน ข้อกำหนดการใช้งาน