OPEN-SOURCE SCRIPT
HM system
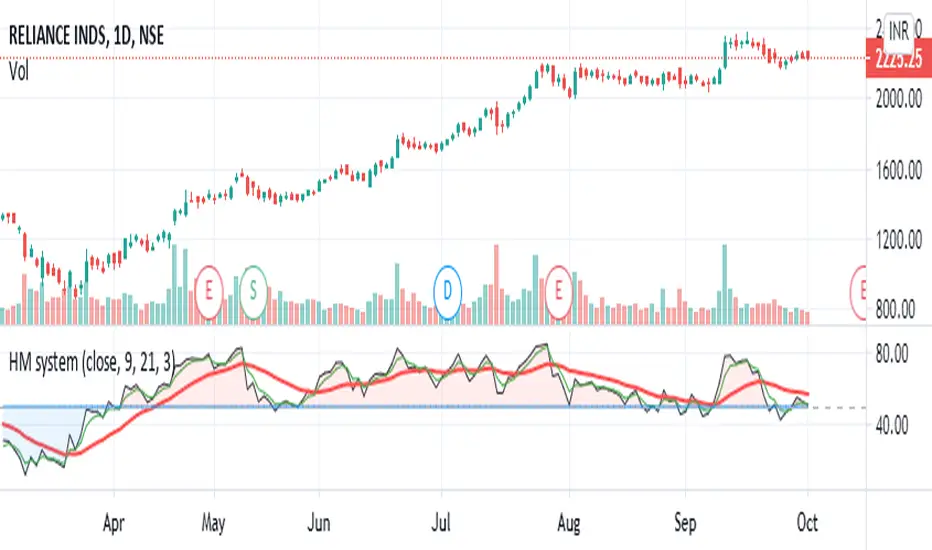
Blank line is RSI (9 days) line
Green line is EMA (3 days) line
Red line is WMA (21 days) line
when RSI EMA line above 50 & WMA is below both ,it is buy signal
when RSI EMA line below 50 & WMA is above both ,it is sell signal
Green line is EMA (3 days) line
Red line is WMA (21 days) line
when RSI EMA line above 50 & WMA is below both ,it is buy signal
when RSI EMA line below 50 & WMA is above both ,it is sell signal
สคริปต์โอเพนซอร์ซ
ด้วยเจตนารมณ์หลักของ TradingView ผู้สร้างสคริปต์นี้ได้ทำให้เป็นโอเพนซอร์ส เพื่อให้เทรดเดอร์สามารถตรวจสอบและยืนยันฟังก์ชันการทำงานของมันได้ ขอชื่นชมผู้เขียน! แม้ว่าคุณจะใช้งานได้ฟรี แต่โปรดจำไว้ว่าการเผยแพร่โค้ดซ้ำจะต้องเป็นไปตาม กฎระเบียบการใช้งาน ของเรา
คำจำกัดสิทธิ์ความรับผิดชอบ
ข้อมูลและบทความไม่ได้มีวัตถุประสงค์เพื่อก่อให้เกิดกิจกรรมทางการเงิน, การลงทุน, การซื้อขาย, ข้อเสนอแนะ หรือคำแนะนำประเภทอื่น ๆ ที่ให้หรือรับรองโดย TradingView อ่านเพิ่มเติมใน ข้อกำหนดการใช้งาน