PROTECTED SOURCE SCRIPT
ที่อัปเดต: GS_QuantEdge
GS_QuantEdge is a focused swing trading tool built for traders who seek tight entries and high risk-reward setups.
What it includes:
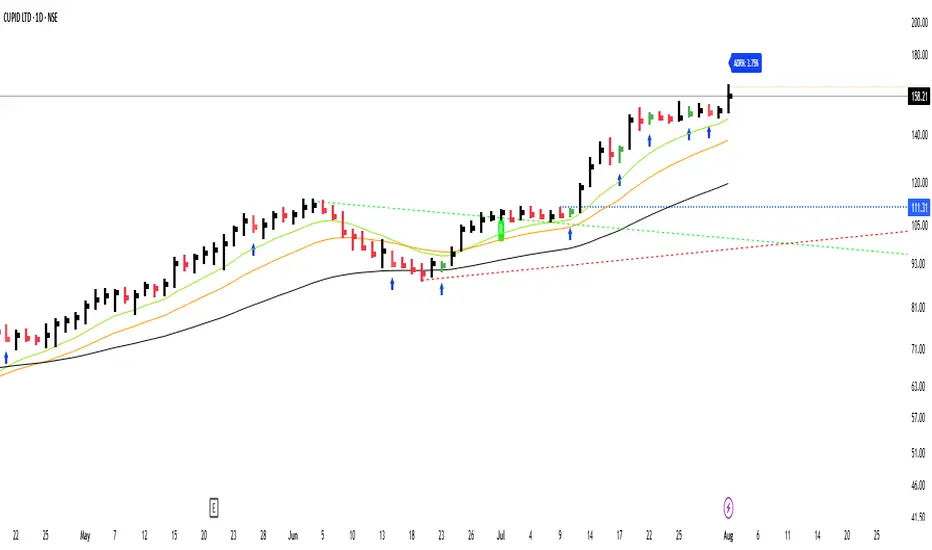
ATR-Based Trendlines:
Automatically plots dynamic upper and lower levels using pivots and ATR-based slope logic. Helps define key price zones where reactions or breakouts are likely.
Inside Bar Detection:
Identifies inside bar candles with subtle blue arrows below the bar and colors the candle — ideal for spotting low-risk compression setups before potential expansion.
ADR% Volatility Label:
Displays the Average Daily Range as a percentage of the current price, helping you assess volatility and optimize position sizing.
EMA Overlay (11, 21, 50):
Plots essential EMAs directly on the chart to observe trend structure and alignment, aiding in identifying high-probability trade zones.
High/Low Flags (hidden by default):
Marks new 11-bar, 21-bar highs and 52-bar lows to signal momentum or exhaustion. Helpful for observing if price is making new highs/lows on different timeframe scales.
How it helps:
This indicator gives swing traders a clean, structured chart view — highlighting areas of compression, breakout zones, and volatility conditions. Whether you're entering early on tight setups or waiting for confirmation, GS_QuantEdge helps you stay focused on well-defined opportunities with optimal risk-to-reward potential.
What it includes:
ATR-Based Trendlines:
Automatically plots dynamic upper and lower levels using pivots and ATR-based slope logic. Helps define key price zones where reactions or breakouts are likely.
Inside Bar Detection:
Identifies inside bar candles with subtle blue arrows below the bar and colors the candle — ideal for spotting low-risk compression setups before potential expansion.
ADR% Volatility Label:
Displays the Average Daily Range as a percentage of the current price, helping you assess volatility and optimize position sizing.
EMA Overlay (11, 21, 50):
Plots essential EMAs directly on the chart to observe trend structure and alignment, aiding in identifying high-probability trade zones.
High/Low Flags (hidden by default):
Marks new 11-bar, 21-bar highs and 52-bar lows to signal momentum or exhaustion. Helpful for observing if price is making new highs/lows on different timeframe scales.
How it helps:
This indicator gives swing traders a clean, structured chart view — highlighting areas of compression, breakout zones, and volatility conditions. Whether you're entering early on tight setups or waiting for confirmation, GS_QuantEdge helps you stay focused on well-defined opportunities with optimal risk-to-reward potential.
เอกสารเผยแพร่
alert conditions for inside bars were added. These alerts will now trigger when any inside bar is formed, or specifically when a bullish or bearish inside bar appears. This makes the indicator compatible with TradingView alerts and also useful in screener-style setups or automation workflows.สคริปต์ที่ได้รับการป้องกัน
สคริปต์นี้ถูกเผยแพร่เป็นแบบ closed-source อย่างไรก็ตาม คุณสามารถใช้ได้อย่างอิสระและไม่มีข้อจำกัดใดๆ – เรียนรู้เพิ่มเติมได้ที่นี่
คำจำกัดสิทธิ์ความรับผิดชอบ
ข้อมูลและบทความไม่ได้มีวัตถุประสงค์เพื่อก่อให้เกิดกิจกรรมทางการเงิน, การลงทุน, การซื้อขาย, ข้อเสนอแนะ หรือคำแนะนำประเภทอื่น ๆ ที่ให้หรือรับรองโดย TradingView อ่านเพิ่มเติมใน ข้อกำหนดการใช้งาน
สคริปต์ที่ได้รับการป้องกัน
สคริปต์นี้ถูกเผยแพร่เป็นแบบ closed-source อย่างไรก็ตาม คุณสามารถใช้ได้อย่างอิสระและไม่มีข้อจำกัดใดๆ – เรียนรู้เพิ่มเติมได้ที่นี่
คำจำกัดสิทธิ์ความรับผิดชอบ
ข้อมูลและบทความไม่ได้มีวัตถุประสงค์เพื่อก่อให้เกิดกิจกรรมทางการเงิน, การลงทุน, การซื้อขาย, ข้อเสนอแนะ หรือคำแนะนำประเภทอื่น ๆ ที่ให้หรือรับรองโดย TradingView อ่านเพิ่มเติมใน ข้อกำหนดการใช้งาน