PROTECTED SOURCE SCRIPT
Institutional AI-Enhanced Market Structure
Institutional AI-Enhanced Market Structure Indicator
COMPREHENSIVE DESCRIPTION
Overview and Purpose
This indicator combines institutional trading concepts (Smart Money Concepts) with a proprietary AI-inspired probability scoring system to identify high-probability trading opportunities. Unlike standard trend-following or support/resistance indicators, this tool integrates multiple institutional order flow concepts and quantifies their confluence through a dynamic scoring algorithm that adapts to market conditions.
The indicator is closed-source because it contains a unique multi-factor probability calculation engine and adaptive parameter optimization system that took extensive development and backtesting to create. The specific weighting, thresholds, and interaction between components represent proprietary intellectual property.
What Makes This Original
1. AI-Inspired Adaptive Probability Scoring System
The core innovation is a dynamic scoring algorithm that evaluates trade setups based on 6 confluence factors:
Market Structure Quality (20 points): Validates Break of Structure (BOS) or Change of Character (CHoCH) using pivot-based swing analysis
Order Flow Strength (15 points): Measures institutional volume participation relative to 20 and 50-period moving averages with standard deviation filtering
Liquidity Engineering (15 points): Detects liquidity sweeps at equal highs/lows (EQL) where retail stop losses cluster
Imbalance Presence (10 points): Identifies unfilled Fair Value Gaps (3-candle imbalances) as institutional entry zones
Market Regime Alignment (10 points): Confirms directional bias through multi-factor regime classification
Volatility Environment (5 points): Penalizes signals during high-volatility "chop" periods
Each factor is weighted based on backtested importance, and the total score (50-100%) must exceed a user-defined threshold before displaying signals. This is NOT a simple indicator mashup—the scoring system dynamically evaluates how these concepts work together in real-time.
2. Dynamic Market Regime Detection
Most indicators use static parameters. This indicator continuously classifies the market into one of four regimes using four calculations:
Trend Strength: EMA(21) vs EMA(50) divergence relative to price
Volatility Ratio: Current price standard deviation vs 50-period average
Volume Regime: Current volume vs 50-period SMA
Average Daily Range: 20-bar high-low range normalized to price
Based on these inputs, the algorithm classifies markets as:
BULL_TREND: Strong upward momentum with above-average volume
BEAR_TREND: Strong downward momentum with above-average volume
RANGING: Low trend strength with contained volatility
VOLATILE: Elevated volatility ratio above 1.5x average
The regime detection then adaptively modifies:
ATR multipliers for stop placement (2.5x in volatile, 1.2x in ranging, 1.8x in trending)
Signal probability requirements (higher in volatile conditions)
Order block decay rates
Fair value gap sensitivity
3. Institutional Order Flow Integration
The indicator detects and tracks institutional footprints through three proprietary methods:
Order Blocks: Unlike simple supply/demand zones, this uses a multi-condition filter:
Volume spike > 2.0 standard deviations above 20-period average
Large candle body > 0.8x ATR
Confirmation of Break of Structure in the same direction
Touch tracking and "tested" status when price revisits
Automatic decay after user-defined bars (prevents chart clutter)
Fair Value Gaps (Imbalances): 3-candle inefficiency detection where:
Bullish FVG: low[0] > high[2] AND close[1] > high[2] (gap between candle 0 and 2)
Bearish FVG: high[0] < low[2] AND close[1] < low[2]
Real-time fill percentage tracking as price revisits the gap
Assumes institutions will defend or fill these imbalances
Liquidity Zones: Detects equal highs/lows where retail stops cluster:
Identifies swing points within user-defined percentage threshold (default 0.3%)
Tracks "sweep" events when price spikes through then reverses (wick through level, close back inside)
Differentiates swept vs unswept liquidity for entry timing
4. Volume-Weighted Dynamic Levels
Instead of simple moving averages or static pivots, support/resistance are calculated using volume-weighted price:
Support = Σ(low × volume) / Σ(volume) for i=0 to 19
Resistance = Σ(high × volume) / Σ(volume) for i=0 to 19
This gives more weight to price levels with higher institutional participation, creating more reliable stop-loss placement when "Adaptive Stop Loss" is enabled.
5. Multi-Timeframe Confluence
The indicator queries daily timeframe data for higher-timeframe confirmation:
Daily EMA trend direction (21 vs 50)
Daily volume regime (above/below 20-period average)
Daily market regime classification
Signals only trigger when current timeframe setup aligns with daily timeframe bias, filtering out counter-trend noise.
How It Works - Technical Methodology
Market Structure Detection (Smart Money Concepts)
Uses ta.pivothigh() and ta.pivotlow() with user-defined strength (default 5 bars each side)
Stores last 50 swing highs and lows in arrays for historical reference
Break of Structure (BOS): Price closes beyond the most recent swing high (bullish) or swing low (bearish)
Change of Character (CHoCH): Price breaks counter-trend structure (low breaks above previous swing low = potential reversal)
Signal Generation Logic
A valid LONG signal requires ALL of the following:
Setup: Bullish BOS or CHoCH confirmed
Confirmation: Bullish liquidity sweep OR unfilled bullish FVG present
HTF Alignment: Daily timeframe in uptrend with above-average volume
Probability Score: AI scoring system returns ≥65% (user adjustable 50-95%)
Risk:Reward: Calculated stop (ATR-based or adaptive) allows minimum 2:1 R:R (user adjustable)
SHORT signals use inverse logic (bearish structure, bearish sweeps/FVGs, daily downtrend).
Adaptive Risk Management
Stop loss calculation adapts based on:
Current market regime (wider stops in volatile markets)
Volume-weighted support/resistance levels when "Adaptive" enabled
Minimum risk threshold (0.2% of price) to avoid over-tight stops
Take profit targets automatically calculate based on user-defined risk:reward ratio (default 2:1).
How To Use This Indicator
Initial Setup
Market Structure Group:
Start with default Swing Strength (5) for 1H-4H timeframes
Increase to 10-15 for daily timeframes
Decrease to 3 for scalping on 5-15min timeframes
AI Features Group:
Set "Signal Probability Threshold" to 65% for balanced approach
Increase to 75-80% for fewer but higher-quality signals
Lower to 60% in strong trending markets for more entries
Risk Management:
Enable "Adaptive Stop Loss" for dynamic support/resistance-based stops
Set "Minimum Risk:Reward" to 2.0 or higher (institutional standard)
Adjust ATR Length (14) based on timeframe (shorter for intraday)
Reading The Signals
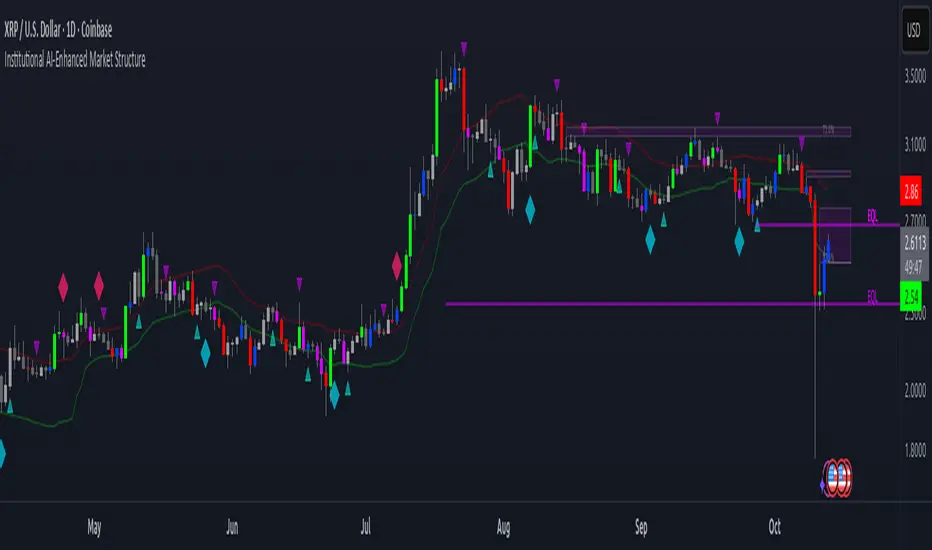
Visual Elements:
Small triangles: Swing highs (red) and lows (green) - market structure pivots
Circles: Break of Structure - lime (bullish) or red (bearish)
Diamonds: Change of Character - cyan (bullish reversal) or orange (bearish reversal)
Boxes: Order blocks (green=bullish, red=bearish, yellow border=tested)
Transparent boxes: Fair Value Gaps (blue=bullish, purple=bearish)
Dashed/solid lines: Liquidity zones (purple=unswept, yellow=swept)
Large arrows: Trade signals with probability % (🔼 LONG / 🔽 SHORT)
Red/Green lines: Stop loss and take profit levels
Statistics Dashboard (top right by default):
Market Regime: Current classification (BULL_TREND, BEAR_TREND, RANGING, VOLATILE)
Volatility Ratio: Current vs average volatility (>1.5 = avoid trading)
Volume Regime: Current vs average volume (>1.2 = strong institutional participation)
Active Order Blocks: Number of untested institutional zones
Unfilled FVGs: Number of imbalances awaiting price return
Liquidity Zones: Unswept equal highs/lows (potential reversal areas)
HTF Alignment: Daily timeframe bias (confirm direction)
Last Signal Prob: Confidence score of most recent signal
Trading Strategy
For LONG Entries:
Wait for bullish BOS or CHoCH marker (circle/diamond below price)
Confirm market regime is BULL_TREND or RANGING (not VOLATILE)
Look for bullish liquidity sweep (yellow line below price) or unfilled bullish FVG (blue box)
When all align, watch for 🔼 LONG signal with probability ≥65%
Enter on signal candle close
Stop loss = red line, Take profit = green line
Monitor FVG fills and order block tests for possible early exit
For SHORT Entries:
Same logic in reverse (bearish structure, BEAR_TREND regime, bearish sweeps/FVGs, 🔽 SHORT signals)
Advanced Usage:
Order Block Confluence: Highest probability entries occur when price retraces to tested order block (yellow border) + FVG overlap
Liquidity Sweep Reversals: Best entries often follow immediate sweep (yellow line) then signal in opposite direction
Regime Filtering: Avoid trading during VOLATILE regime or when volatility ratio >1.5
HTF Confirmation: Only take signals when HTF Alignment matches direction (BULLISH for longs, BEARISH for shorts)
Customization:
Every visual element has individual toggle and color controls in settings:
Hide swing points if chart too cluttered
Disable BOS/CHoCH markers if only using order blocks
Turn off FVGs if focusing on liquidity sweeps
Customize colors to match your chart theme
Reposition dashboard to any corner
Why This Requires Closed-Source Protection
This indicator represents months of development integrating:
Proprietary probability weighting system - The specific point allocation (20/15/15/10/10/5) and interaction logic between factors is based on extensive backtesting across multiple markets and timeframes
Adaptive parameter optimization algorithms - How the indicator modifies ATR multipliers, decay rates, and thresholds based on regime detection uses proprietary mathematical relationships
Volume-weighted level calculations - The specific lookback periods and weighting formulas for dynamic support/resistance are optimized through statistical analysis
Multi-factor regime classification - The exact thresholds for trend strength (0.02), volatility ratio (1.3/1.5), and volume regime (1.0/1.2) are calibrated values
While the underlying concepts (SMC, order blocks, FVGs) are known, the integration methodology, scoring system, and adaptive algorithms are original intellectual property. An open-source version would allow immediate copying of years of development work, defeating the purpose of creating a professional-grade tool.
The detailed description above provides traders with complete transparency on WHAT the indicator does and HOW to use it effectively, without revealing the exact mathematical relationships and thresholds that make it effective.
Disclaimer
This indicator is an analytical tool for identifying potential trading opportunities based on institutional order flow concepts. It does not guarantee profits and should be used alongside proper risk management, fundamental analysis, and personal trading rules. Past performance does not indicate future results. Always use stop losses and never risk more than you can afford to lose.
COMPREHENSIVE DESCRIPTION
Overview and Purpose
This indicator combines institutional trading concepts (Smart Money Concepts) with a proprietary AI-inspired probability scoring system to identify high-probability trading opportunities. Unlike standard trend-following or support/resistance indicators, this tool integrates multiple institutional order flow concepts and quantifies their confluence through a dynamic scoring algorithm that adapts to market conditions.
The indicator is closed-source because it contains a unique multi-factor probability calculation engine and adaptive parameter optimization system that took extensive development and backtesting to create. The specific weighting, thresholds, and interaction between components represent proprietary intellectual property.
What Makes This Original
1. AI-Inspired Adaptive Probability Scoring System
The core innovation is a dynamic scoring algorithm that evaluates trade setups based on 6 confluence factors:
Market Structure Quality (20 points): Validates Break of Structure (BOS) or Change of Character (CHoCH) using pivot-based swing analysis
Order Flow Strength (15 points): Measures institutional volume participation relative to 20 and 50-period moving averages with standard deviation filtering
Liquidity Engineering (15 points): Detects liquidity sweeps at equal highs/lows (EQL) where retail stop losses cluster
Imbalance Presence (10 points): Identifies unfilled Fair Value Gaps (3-candle imbalances) as institutional entry zones
Market Regime Alignment (10 points): Confirms directional bias through multi-factor regime classification
Volatility Environment (5 points): Penalizes signals during high-volatility "chop" periods
Each factor is weighted based on backtested importance, and the total score (50-100%) must exceed a user-defined threshold before displaying signals. This is NOT a simple indicator mashup—the scoring system dynamically evaluates how these concepts work together in real-time.
2. Dynamic Market Regime Detection
Most indicators use static parameters. This indicator continuously classifies the market into one of four regimes using four calculations:
Trend Strength: EMA(21) vs EMA(50) divergence relative to price
Volatility Ratio: Current price standard deviation vs 50-period average
Volume Regime: Current volume vs 50-period SMA
Average Daily Range: 20-bar high-low range normalized to price
Based on these inputs, the algorithm classifies markets as:
BULL_TREND: Strong upward momentum with above-average volume
BEAR_TREND: Strong downward momentum with above-average volume
RANGING: Low trend strength with contained volatility
VOLATILE: Elevated volatility ratio above 1.5x average
The regime detection then adaptively modifies:
ATR multipliers for stop placement (2.5x in volatile, 1.2x in ranging, 1.8x in trending)
Signal probability requirements (higher in volatile conditions)
Order block decay rates
Fair value gap sensitivity
3. Institutional Order Flow Integration
The indicator detects and tracks institutional footprints through three proprietary methods:
Order Blocks: Unlike simple supply/demand zones, this uses a multi-condition filter:
Volume spike > 2.0 standard deviations above 20-period average
Large candle body > 0.8x ATR
Confirmation of Break of Structure in the same direction
Touch tracking and "tested" status when price revisits
Automatic decay after user-defined bars (prevents chart clutter)
Fair Value Gaps (Imbalances): 3-candle inefficiency detection where:
Bullish FVG: low[0] > high[2] AND close[1] > high[2] (gap between candle 0 and 2)
Bearish FVG: high[0] < low[2] AND close[1] < low[2]
Real-time fill percentage tracking as price revisits the gap
Assumes institutions will defend or fill these imbalances
Liquidity Zones: Detects equal highs/lows where retail stops cluster:
Identifies swing points within user-defined percentage threshold (default 0.3%)
Tracks "sweep" events when price spikes through then reverses (wick through level, close back inside)
Differentiates swept vs unswept liquidity for entry timing
4. Volume-Weighted Dynamic Levels
Instead of simple moving averages or static pivots, support/resistance are calculated using volume-weighted price:
Support = Σ(low × volume) / Σ(volume) for i=0 to 19
Resistance = Σ(high × volume) / Σ(volume) for i=0 to 19
This gives more weight to price levels with higher institutional participation, creating more reliable stop-loss placement when "Adaptive Stop Loss" is enabled.
5. Multi-Timeframe Confluence
The indicator queries daily timeframe data for higher-timeframe confirmation:
Daily EMA trend direction (21 vs 50)
Daily volume regime (above/below 20-period average)
Daily market regime classification
Signals only trigger when current timeframe setup aligns with daily timeframe bias, filtering out counter-trend noise.
How It Works - Technical Methodology
Market Structure Detection (Smart Money Concepts)
Uses ta.pivothigh() and ta.pivotlow() with user-defined strength (default 5 bars each side)
Stores last 50 swing highs and lows in arrays for historical reference
Break of Structure (BOS): Price closes beyond the most recent swing high (bullish) or swing low (bearish)
Change of Character (CHoCH): Price breaks counter-trend structure (low breaks above previous swing low = potential reversal)
Signal Generation Logic
A valid LONG signal requires ALL of the following:
Setup: Bullish BOS or CHoCH confirmed
Confirmation: Bullish liquidity sweep OR unfilled bullish FVG present
HTF Alignment: Daily timeframe in uptrend with above-average volume
Probability Score: AI scoring system returns ≥65% (user adjustable 50-95%)
Risk:Reward: Calculated stop (ATR-based or adaptive) allows minimum 2:1 R:R (user adjustable)
SHORT signals use inverse logic (bearish structure, bearish sweeps/FVGs, daily downtrend).
Adaptive Risk Management
Stop loss calculation adapts based on:
Current market regime (wider stops in volatile markets)
Volume-weighted support/resistance levels when "Adaptive" enabled
Minimum risk threshold (0.2% of price) to avoid over-tight stops
Take profit targets automatically calculate based on user-defined risk:reward ratio (default 2:1).
How To Use This Indicator
Initial Setup
Market Structure Group:
Start with default Swing Strength (5) for 1H-4H timeframes
Increase to 10-15 for daily timeframes
Decrease to 3 for scalping on 5-15min timeframes
AI Features Group:
Set "Signal Probability Threshold" to 65% for balanced approach
Increase to 75-80% for fewer but higher-quality signals
Lower to 60% in strong trending markets for more entries
Risk Management:
Enable "Adaptive Stop Loss" for dynamic support/resistance-based stops
Set "Minimum Risk:Reward" to 2.0 or higher (institutional standard)
Adjust ATR Length (14) based on timeframe (shorter for intraday)
Reading The Signals
Visual Elements:
Small triangles: Swing highs (red) and lows (green) - market structure pivots
Circles: Break of Structure - lime (bullish) or red (bearish)
Diamonds: Change of Character - cyan (bullish reversal) or orange (bearish reversal)
Boxes: Order blocks (green=bullish, red=bearish, yellow border=tested)
Transparent boxes: Fair Value Gaps (blue=bullish, purple=bearish)
Dashed/solid lines: Liquidity zones (purple=unswept, yellow=swept)
Large arrows: Trade signals with probability % (🔼 LONG / 🔽 SHORT)
Red/Green lines: Stop loss and take profit levels
Statistics Dashboard (top right by default):
Market Regime: Current classification (BULL_TREND, BEAR_TREND, RANGING, VOLATILE)
Volatility Ratio: Current vs average volatility (>1.5 = avoid trading)
Volume Regime: Current vs average volume (>1.2 = strong institutional participation)
Active Order Blocks: Number of untested institutional zones
Unfilled FVGs: Number of imbalances awaiting price return
Liquidity Zones: Unswept equal highs/lows (potential reversal areas)
HTF Alignment: Daily timeframe bias (confirm direction)
Last Signal Prob: Confidence score of most recent signal
Trading Strategy
For LONG Entries:
Wait for bullish BOS or CHoCH marker (circle/diamond below price)
Confirm market regime is BULL_TREND or RANGING (not VOLATILE)
Look for bullish liquidity sweep (yellow line below price) or unfilled bullish FVG (blue box)
When all align, watch for 🔼 LONG signal with probability ≥65%
Enter on signal candle close
Stop loss = red line, Take profit = green line
Monitor FVG fills and order block tests for possible early exit
For SHORT Entries:
Same logic in reverse (bearish structure, BEAR_TREND regime, bearish sweeps/FVGs, 🔽 SHORT signals)
Advanced Usage:
Order Block Confluence: Highest probability entries occur when price retraces to tested order block (yellow border) + FVG overlap
Liquidity Sweep Reversals: Best entries often follow immediate sweep (yellow line) then signal in opposite direction
Regime Filtering: Avoid trading during VOLATILE regime or when volatility ratio >1.5
HTF Confirmation: Only take signals when HTF Alignment matches direction (BULLISH for longs, BEARISH for shorts)
Customization:
Every visual element has individual toggle and color controls in settings:
Hide swing points if chart too cluttered
Disable BOS/CHoCH markers if only using order blocks
Turn off FVGs if focusing on liquidity sweeps
Customize colors to match your chart theme
Reposition dashboard to any corner
Why This Requires Closed-Source Protection
This indicator represents months of development integrating:
Proprietary probability weighting system - The specific point allocation (20/15/15/10/10/5) and interaction logic between factors is based on extensive backtesting across multiple markets and timeframes
Adaptive parameter optimization algorithms - How the indicator modifies ATR multipliers, decay rates, and thresholds based on regime detection uses proprietary mathematical relationships
Volume-weighted level calculations - The specific lookback periods and weighting formulas for dynamic support/resistance are optimized through statistical analysis
Multi-factor regime classification - The exact thresholds for trend strength (0.02), volatility ratio (1.3/1.5), and volume regime (1.0/1.2) are calibrated values
While the underlying concepts (SMC, order blocks, FVGs) are known, the integration methodology, scoring system, and adaptive algorithms are original intellectual property. An open-source version would allow immediate copying of years of development work, defeating the purpose of creating a professional-grade tool.
The detailed description above provides traders with complete transparency on WHAT the indicator does and HOW to use it effectively, without revealing the exact mathematical relationships and thresholds that make it effective.
Disclaimer
This indicator is an analytical tool for identifying potential trading opportunities based on institutional order flow concepts. It does not guarantee profits and should be used alongside proper risk management, fundamental analysis, and personal trading rules. Past performance does not indicate future results. Always use stop losses and never risk more than you can afford to lose.
สคริปต์ที่ได้รับการป้องกัน
สคริปต์นี้ถูกเผยแพร่เป็นแบบ closed-source อย่างไรก็ตาม คุณสามารถใช้ได้อย่างอิสระและไม่มีข้อจำกัดใดๆ – เรียนรู้เพิ่มเติมได้ที่นี่
คำจำกัดสิทธิ์ความรับผิดชอบ
ข้อมูลและบทความไม่ได้มีวัตถุประสงค์เพื่อก่อให้เกิดกิจกรรมทางการเงิน, การลงทุน, การซื้อขาย, ข้อเสนอแนะ หรือคำแนะนำประเภทอื่น ๆ ที่ให้หรือรับรองโดย TradingView อ่านเพิ่มเติมที่ ข้อกำหนดการใช้งาน