MAPS - HiLo Divergence
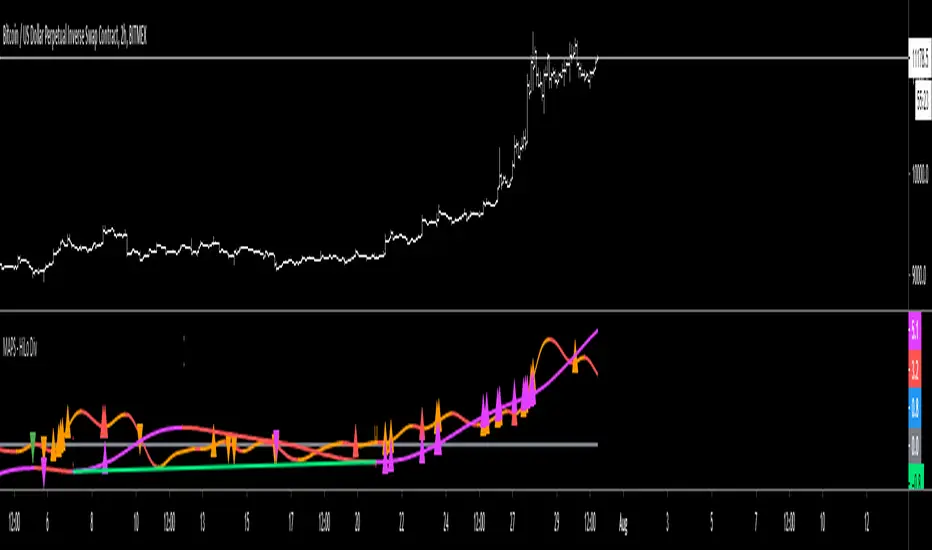
Purple oscillator = Higher Timeframe's price measurement
Purple high triangle = A local high on the higher timeframe has been made
Purple low triangle = A local low on the higher timeframe has been made
Red high triangle on the purple oscillator = A local high on the higher timeframe has been made and is deemed a bearish divergent high
Green low triangle on the purple oscillator = A local low on the higher timeframe has been made and is deemed a bullish divergent low
Orange oscillator = Current Timeframe's price measurement
Orange high triangle = A local high on the current timeframe has been made
Orange low triangle = A local low on the current timeframe has been made
Red high triangle on the orange oscillator = A local high on the current timeframe has been made and is deemed a bearish divergent high
Green low triangle on the orange oscillator = A local low on the current timeframe has been made and is deemed a bullish divergent low
สคริปต์แบบเฉพาะผู้ได้รับเชิญเท่านั้น
เฉพาะผู้ใช้งานที่ผู้เขียนอนุมัตเท่านั้นจึงจะสามารถเข้าถึงสคริปต์นี้ได้ คุณจะต้องขอและได้รับอนุญาตก่อนใช้งาน ซึ่งโดยทั่วไปจะได้รับอนุญาตหลังจากชำระเงินแล้ว สำหรับรายละเอียดเพิ่มเติม โปรดทำตามคำแนะนำของผู้เขียนด้านล่าง หรือติดต่อ TheTimeCount โดยตรง
TradingView ไม่แนะนำให้จ่ายเงินหรือใช้สคริปต์ เว้นแต่คุณจะเชื่อถือผู้เขียนและเข้าใจวิธีการทำงานของสคริปต์นั้นอย่างถ่องแท้ คุณยังสามารถหาทางเลือกแบบโอเพนซอร์สฟรีได้ใน สคริปต์ชุมชนของเรา
คำแนะนำของผู้เขียน
คำจำกัดสิทธิ์ความรับผิดชอบ
สคริปต์แบบเฉพาะผู้ได้รับเชิญเท่านั้น
เฉพาะผู้ใช้งานที่ผู้เขียนอนุมัตเท่านั้นจึงจะสามารถเข้าถึงสคริปต์นี้ได้ คุณจะต้องขอและได้รับอนุญาตก่อนใช้งาน ซึ่งโดยทั่วไปจะได้รับอนุญาตหลังจากชำระเงินแล้ว สำหรับรายละเอียดเพิ่มเติม โปรดทำตามคำแนะนำของผู้เขียนด้านล่าง หรือติดต่อ TheTimeCount โดยตรง
TradingView ไม่แนะนำให้จ่ายเงินหรือใช้สคริปต์ เว้นแต่คุณจะเชื่อถือผู้เขียนและเข้าใจวิธีการทำงานของสคริปต์นั้นอย่างถ่องแท้ คุณยังสามารถหาทางเลือกแบบโอเพนซอร์สฟรีได้ใน สคริปต์ชุมชนของเรา