OPEN-SOURCE SCRIPT
sadosi trends and barrier
This indicator should be used for give ideas.
what they can do?
how can?
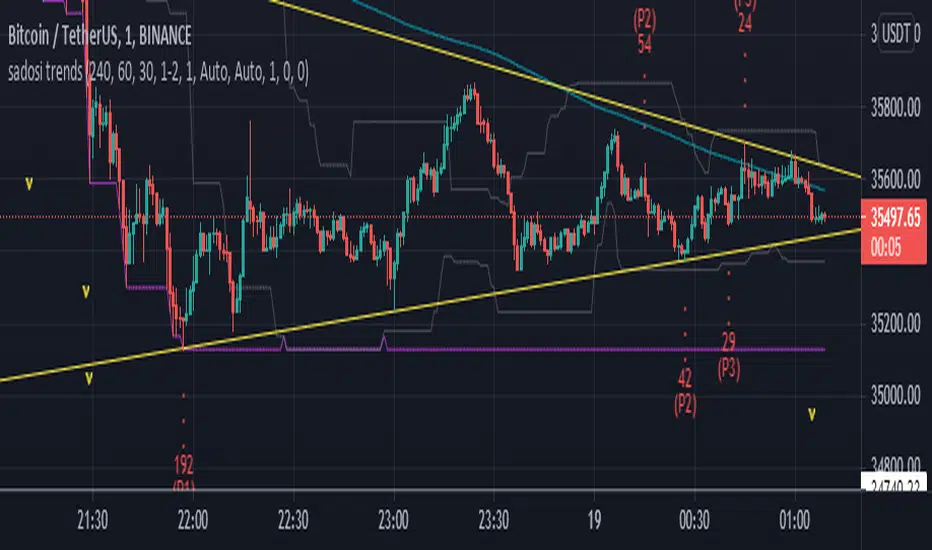
By analyzing the prices in the 3 selected periods, 3 highs and 3 lows prices are marked. With the marked points, trend and resistance lines are drawn. The current price is analyzed and useful calculations displayed in the info box. Finaly adding moving averages. After all these transactions, the trend and resistances become easily visible on the chart.
You can fine-tune the angle of the trend using high and low extensions
you can catch different trend lines by changing the high and low trend points
By changing the periods, you can set position the trend lines more accurately.
When the price is too low or too high, the information box will warn you by change color.
The trend lines to be created are for the purpose of giving an idea and convenience. It can be used on all timeframes, including horizontal trends.
what they can do?
- draw up and down trend lines
- draw support and resistance lines
- to inform about the current price
- signal for high and low prices
how can?
By analyzing the prices in the 3 selected periods, 3 highs and 3 lows prices are marked. With the marked points, trend and resistance lines are drawn. The current price is analyzed and useful calculations displayed in the info box. Finaly adding moving averages. After all these transactions, the trend and resistances become easily visible on the chart.
You can fine-tune the angle of the trend using high and low extensions
you can catch different trend lines by changing the high and low trend points
By changing the periods, you can set position the trend lines more accurately.
When the price is too low or too high, the information box will warn you by change color.
The trend lines to be created are for the purpose of giving an idea and convenience. It can be used on all timeframes, including horizontal trends.
สคริปต์โอเพนซอร์ซ
ด้วยเจตนารมณ์หลักของ TradingView ผู้สร้างสคริปต์นี้ได้ทำให้เป็นโอเพนซอร์ส เพื่อให้เทรดเดอร์สามารถตรวจสอบและยืนยันฟังก์ชันการทำงานของมันได้ ขอชื่นชมผู้เขียน! แม้ว่าคุณจะใช้งานได้ฟรี แต่โปรดจำไว้ว่าการเผยแพร่โค้ดซ้ำจะต้องเป็นไปตาม กฎระเบียบการใช้งาน ของเรา
คำจำกัดสิทธิ์ความรับผิดชอบ
ข้อมูลและบทความไม่ได้มีวัตถุประสงค์เพื่อก่อให้เกิดกิจกรรมทางการเงิน, การลงทุน, การซื้อขาย, ข้อเสนอแนะ หรือคำแนะนำประเภทอื่น ๆ ที่ให้หรือรับรองโดย TradingView อ่านเพิ่มเติมใน ข้อกำหนดการใช้งาน