OPEN-SOURCE SCRIPT
ที่อัปเดต: TechniTrend: Dynamic Pair Correlation
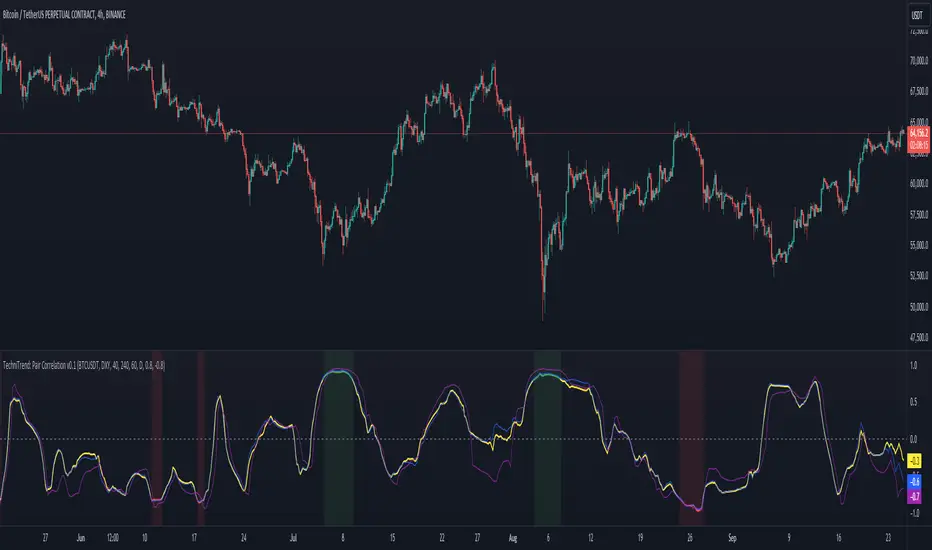
TechniTrend: Dynamic Pair Correlation
Description:
The TechniTrend: Dynamic Pair Correlation is a powerful and versatile indicator designed to track the correlation between two assets—whether cryptocurrencies, indices, or other financial instruments—across multiple timeframes. Understanding correlations can provide deep insights into market behavior, helping traders make informed decisions based on how two assets move in relation to each other.
Key Features:
Customizable Pair Selection: Compare any two assets (e.g., Bitcoin and DXY, Ethereum and SP500) to study how their price movements relate over time.
Multi-Timeframe Analysis: Simultaneously track correlations across different timeframes—standard, lower, and higher—providing a comprehensive view of market dynamics.
Dynamic Color Coding for Correlation Strength: Instantly spot correlations with visually intuitive colors—green for strong positive correlation, red for strong negative correlation, and yellow for neutral.
Heatmap Background: An easy-to-read background color heatmap highlights when correlations hit extreme levels, adding another layer of insight to your charts.
Real-Time Alerts: Get notified when correlations exceed your custom thresholds, signaling opportunities for potential breakouts, reversals, or divergences.
Divergence Detection: Automatically highlight moments when asset prices diverge, offering potential entry/exit points for smart trading decisions.
How to Use:
Asset Pair Comparison: Select two symbols to analyze their price correlation, such as BTC/USDT and DXY, or any other pair that fits your strategy.
Set Your Timeframes: Customize your standard, lower, and higher timeframes to monitor correlations at different intervals, allowing you to capture both short-term and long-term relationships.
Track Correlation Strength: Use dynamic color coding to quickly see how closely two assets are moving together. Strong correlations (positive or negative) could signal potential opportunities, while low correlations may indicate the absence of a strong trend.
Utilize Alerts: Receive real-time alerts when correlations cross your predefined thresholds, helping you take action when the market presents strong alignment or divergence.
Divergence Signals: Watch for divergence between the assets on multiple timeframes, which could indicate a potential trend reversal or a shift in market behavior.
Why It’s Essential:
Understanding the relationship between two assets can be a game changer for traders. Whether you're comparing Bitcoin to DXY, tracking the correlation between Ethereum and major indices, or evaluating two cryptocurrencies, this indicator gives you the tools to visualize and respond to market conditions with precision.
Perfect For:
Crypto traders looking to optimize strategies by monitoring the relationship between major cryptocurrencies and other assets.
Arbitrageurs seeking to capitalize on temporary pricing anomalies between correlated pairs.
Trend-followers aiming to catch large movements by detecting alignment or divergence between asset classes.
Portfolio managers monitoring how different asset classes impact each other to hedge or diversify investments.
By leveraging the TechniTrend: Dynamic Pair Correlation indicator, traders can gain deeper insights into market trends, correlations, and divergences, giving them an edge in fast-moving markets.
เอกสารเผยแพร่
(tiny bug on chart fixed)สคริปต์โอเพนซอร์ซ
ด้วยเจตนารมณ์หลักของ TradingView ผู้สร้างสคริปต์นี้ได้ทำให้เป็นโอเพนซอร์ส เพื่อให้เทรดเดอร์สามารถตรวจสอบและยืนยันฟังก์ชันการทำงานของมันได้ ขอชื่นชมผู้เขียน! แม้ว่าคุณจะใช้งานได้ฟรี แต่โปรดจำไว้ว่าการเผยแพร่โค้ดซ้ำจะต้องเป็นไปตาม กฎระเบียบการใช้งาน ของเรา
คำจำกัดสิทธิ์ความรับผิดชอบ
ข้อมูลและบทความไม่ได้มีวัตถุประสงค์เพื่อก่อให้เกิดกิจกรรมทางการเงิน, การลงทุน, การซื้อขาย, ข้อเสนอแนะ หรือคำแนะนำประเภทอื่น ๆ ที่ให้หรือรับรองโดย TradingView อ่านเพิ่มเติมใน ข้อกำหนดการใช้งาน
สคริปต์โอเพนซอร์ซ
ด้วยเจตนารมณ์หลักของ TradingView ผู้สร้างสคริปต์นี้ได้ทำให้เป็นโอเพนซอร์ส เพื่อให้เทรดเดอร์สามารถตรวจสอบและยืนยันฟังก์ชันการทำงานของมันได้ ขอชื่นชมผู้เขียน! แม้ว่าคุณจะใช้งานได้ฟรี แต่โปรดจำไว้ว่าการเผยแพร่โค้ดซ้ำจะต้องเป็นไปตาม กฎระเบียบการใช้งาน ของเรา
คำจำกัดสิทธิ์ความรับผิดชอบ
ข้อมูลและบทความไม่ได้มีวัตถุประสงค์เพื่อก่อให้เกิดกิจกรรมทางการเงิน, การลงทุน, การซื้อขาย, ข้อเสนอแนะ หรือคำแนะนำประเภทอื่น ๆ ที่ให้หรือรับรองโดย TradingView อ่านเพิ่มเติมใน ข้อกำหนดการใช้งาน