OPEN-SOURCE SCRIPT
Candlestick Combo Strategy - [CLEVER]
📊 Strategy Name:
Candlestick Combo Strategy – [CLEVER]
🧠 Purpose
This strategy is built to identify high-probability reversal or continuation setups based on a combination of classic Japanese candlestick patterns filtered through a trend indicator (50-period SMA) and volatility measure (ATR).
It automatically executes long or short trades when multiple conditions align — giving traders a rules-based, mechanical approach to using price action patterns.
⚙️ Core Components Explained
1. Trend & Volatility Filters
50-period SMA (Simple Moving Average):
Defines market direction.
If price > SMA → Uptrend (only long signals considered).
If price < SMA → Downtrend (only short signals considered).
ATR (Average True Range):
Used to measure volatility and define the size of candlestick patterns.
Helps distinguish strong candles from normal noise.
Also used to calculate stop-loss and target levels dynamically.
2. Candlestick Patterns Detected
The script detects 8 classical patterns, some bullish (for long entries) and some bearish (for short entries).
Each pattern has specific rules based on candle bodies, wicks, and relative positioning.
🟩 Bullish (Long) Patterns
Pattern Description
Mat Hold Strong bullish continuation: a long green candle, small consolidation, then another bullish breakout.
Tower Bottom Reversal setup: large bearish candle, several small neutral candles (base), followed by a large bullish candle.
Rising Window Gap-up pattern signaling bullish strength and momentum continuation.
Bullish Marubozu Full-body bullish candle with little to no wicks — represents aggressive buying pressure.
🟥 Bearish (Short) Patterns
Pattern Description
Matching High Two strong bullish candles with nearly identical highs — signals exhaustion and potential reversal.
Falling Window Gap-down continuation pattern — confirms bearish momentum.
Bearish Marubozu Full-body bearish candle with minimal wicks — represents strong selling pressure.
Long-Legged Doji High indecision after an uptrend — potential reversal warning when confirmed by trend filter.
3. Trade Signal Logic
Long Signal:
Generated when the market is in an uptrend and one of the bullish patterns forms.
Short Signal:
Generated when the market is in a downtrend and one of the bearish patterns appears.
This ensures that signals align with the overall market structure and aren’t triggered in the opposite direction of momentum.
4. Risk Management & Trade Execution
Each trade is managed with automatic stop-loss (SL) and take-profit (TP) levels based on recent price swings and risk-to-reward ratio.
Stop-Loss (SL):
For long trades → lowest low of the last 10 bars.
For short trades → highest high of the last 10 bars.
Target (TP):
Based on user-defined risk:reward ratio (RR), default is 2:1.
ATR Multiplier:
Ensures only strong patterns (larger than average candle size) trigger trades.
Trade Limiter:
The strategy includes maxOpenTrades, which restricts how many trades can be open at once (default = 1), preventing overexposure.
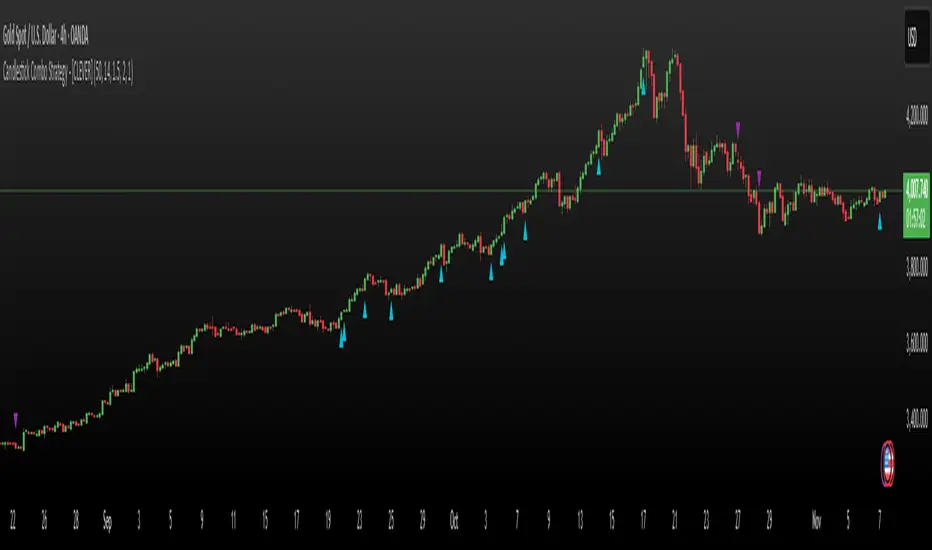
5. Visual Signals
Green Triangles (▲) → Long entry signals appear below candles.
Red Triangles (▼) → Short entry signals appear above candles.
These markers visually represent where the strategy detects valid setups.
💡 Trading Logic Summary
Condition Requirement
Trend Based on 50-SMA (uptrend = long, downtrend = short)
Pattern Strength Verified using ATR for realistic volatility filtering
Entry Triggered only when both trend and pattern align
Exit Stop and target auto-calculated (Risk:Reward = configurable)
Trade Control Limits number of concurrent open positions
🧩 Best Use Cases
Timeframes: Works best on 1H, 4H, or daily charts.
Markets: Suitable for Forex, indices, and commodities.
Trading Style: Ideal for swing traders and technical analysts who prefer price action confirmation.
✅ Summary Table
Feature Description
Strategy Type Price Action + Candlestick Pattern Recognition
Trend Filter 50-SMA
Volatility Filter ATR-based
Patterns Used 8 classic bullish/bearish candlestick formations
Trade Management Auto SL/TP via recent swing levels
Customization Adjustable ATR, SMA, Risk:Reward, and max trades
Objective Identify high-probability reversal or continuation setups with disciplined risk control DXY
DXY  XAUUSD
 AUDJPY
 GBPMXN
  BTCUSD
  USOIL
USOIL 
 USDCHF
  NOKJPY
  SEKJPY
Candlestick Combo Strategy – [CLEVER]
🧠 Purpose
This strategy is built to identify high-probability reversal or continuation setups based on a combination of classic Japanese candlestick patterns filtered through a trend indicator (50-period SMA) and volatility measure (ATR).
It automatically executes long or short trades when multiple conditions align — giving traders a rules-based, mechanical approach to using price action patterns.
⚙️ Core Components Explained
1. Trend & Volatility Filters
50-period SMA (Simple Moving Average):
Defines market direction.
If price > SMA → Uptrend (only long signals considered).
If price < SMA → Downtrend (only short signals considered).
ATR (Average True Range):
Used to measure volatility and define the size of candlestick patterns.
Helps distinguish strong candles from normal noise.
Also used to calculate stop-loss and target levels dynamically.
2. Candlestick Patterns Detected
The script detects 8 classical patterns, some bullish (for long entries) and some bearish (for short entries).
Each pattern has specific rules based on candle bodies, wicks, and relative positioning.
🟩 Bullish (Long) Patterns
Pattern Description
Mat Hold Strong bullish continuation: a long green candle, small consolidation, then another bullish breakout.
Tower Bottom Reversal setup: large bearish candle, several small neutral candles (base), followed by a large bullish candle.
Rising Window Gap-up pattern signaling bullish strength and momentum continuation.
Bullish Marubozu Full-body bullish candle with little to no wicks — represents aggressive buying pressure.
🟥 Bearish (Short) Patterns
Pattern Description
Matching High Two strong bullish candles with nearly identical highs — signals exhaustion and potential reversal.
Falling Window Gap-down continuation pattern — confirms bearish momentum.
Bearish Marubozu Full-body bearish candle with minimal wicks — represents strong selling pressure.
Long-Legged Doji High indecision after an uptrend — potential reversal warning when confirmed by trend filter.
3. Trade Signal Logic
Long Signal:
Generated when the market is in an uptrend and one of the bullish patterns forms.
Short Signal:
Generated when the market is in a downtrend and one of the bearish patterns appears.
This ensures that signals align with the overall market structure and aren’t triggered in the opposite direction of momentum.
4. Risk Management & Trade Execution
Each trade is managed with automatic stop-loss (SL) and take-profit (TP) levels based on recent price swings and risk-to-reward ratio.
Stop-Loss (SL):
For long trades → lowest low of the last 10 bars.
For short trades → highest high of the last 10 bars.
Target (TP):
Based on user-defined risk:reward ratio (RR), default is 2:1.
ATR Multiplier:
Ensures only strong patterns (larger than average candle size) trigger trades.
Trade Limiter:
The strategy includes maxOpenTrades, which restricts how many trades can be open at once (default = 1), preventing overexposure.
5. Visual Signals
Green Triangles (▲) → Long entry signals appear below candles.
Red Triangles (▼) → Short entry signals appear above candles.
These markers visually represent where the strategy detects valid setups.
💡 Trading Logic Summary
Condition Requirement
Trend Based on 50-SMA (uptrend = long, downtrend = short)
Pattern Strength Verified using ATR for realistic volatility filtering
Entry Triggered only when both trend and pattern align
Exit Stop and target auto-calculated (Risk:Reward = configurable)
Trade Control Limits number of concurrent open positions
🧩 Best Use Cases
Timeframes: Works best on 1H, 4H, or daily charts.
Markets: Suitable for Forex, indices, and commodities.
Trading Style: Ideal for swing traders and technical analysts who prefer price action confirmation.
✅ Summary Table
Feature Description
Strategy Type Price Action + Candlestick Pattern Recognition
Trend Filter 50-SMA
Volatility Filter ATR-based
Patterns Used 8 classic bullish/bearish candlestick formations
Trade Management Auto SL/TP via recent swing levels
Customization Adjustable ATR, SMA, Risk:Reward, and max trades
Objective Identify high-probability reversal or continuation setups with disciplined risk control
สคริปต์โอเพนซอร์ซ
ด้วยเจตนารมณ์หลักของ TradingView ผู้สร้างสคริปต์นี้ได้ทำให้มันเป็นโอเพ่นซอร์ส เพื่อให้เทรดเดอร์สามารถตรวจสอบและยืนยันการทำงานของสคริปต์ได้ ขอแสดงความชื่นชมผู้เขียน! แม้ว่าคุณจะสามารถใช้งานได้ฟรี แต่อย่าลืมว่าการเผยแพร่โค้ดซ้ำนั้นจะต้องเป็นไปตามกฎระเบียบการใช้งานของเรา
คำจำกัดสิทธิ์ความรับผิดชอบ
ข้อมูลและบทความไม่ได้มีวัตถุประสงค์เพื่อก่อให้เกิดกิจกรรมทางการเงิน, การลงทุน, การซื้อขาย, ข้อเสนอแนะ หรือคำแนะนำประเภทอื่น ๆ ที่ให้หรือรับรองโดย TradingView อ่านเพิ่มเติมที่ ข้อกำหนดการใช้งาน