OPEN-SOURCE SCRIPT
Valuation Metrics Table (P/S, P/E, etc.)
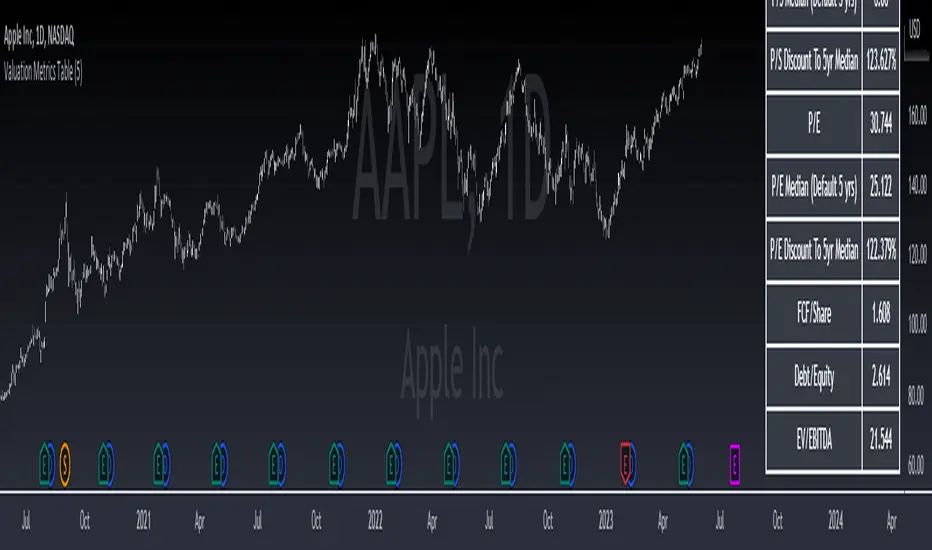
This table gives the user a very easy way of seeing many valuation metrics. I also included the 5 year median of the price to sales and price to earnings ratios. Then I calculated the percent difference between the median and the current ratio. This gives a sense of whether or not a stock is over valued or under valued based on historical data. The other ratios are well known and don't require any explanation. You can turn off the ones you don't want in the settings of the indicator. Another thing to mention is that diluted EPS is used in calculations
สคริปต์โอเพนซอร์ซ
ด้วยเจตนารมณ์หลักของ TradingView ผู้สร้างสคริปต์นี้ได้ทำให้เป็นโอเพนซอร์ส เพื่อให้เทรดเดอร์สามารถตรวจสอบและยืนยันฟังก์ชันการทำงานของมันได้ ขอชื่นชมผู้เขียน! แม้ว่าคุณจะใช้งานได้ฟรี แต่โปรดจำไว้ว่าการเผยแพร่โค้ดซ้ำจะต้องเป็นไปตาม กฎระเบียบการใช้งาน ของเรา
คำจำกัดสิทธิ์ความรับผิดชอบ
ข้อมูลและบทความไม่ได้มีวัตถุประสงค์เพื่อก่อให้เกิดกิจกรรมทางการเงิน, การลงทุน, การซื้อขาย, ข้อเสนอแนะ หรือคำแนะนำประเภทอื่น ๆ ที่ให้หรือรับรองโดย TradingView อ่านเพิ่มเติมใน ข้อกำหนดการใช้งาน