OPEN-SOURCE SCRIPT
ที่อัปเดต: Buying Selling Ratio with Label
Automate your pinescript to Tradovate/Ninja-Trader! ninja-view.com/
The "Buying Selling Ratio with Label" indicator calculates and displays the buying and selling ratio based on volume and price movements. Here's a description of its functionality:
The indicator calculates the buying and selling volumes using the formula:
Buying = Volume * ((Close - Low) / (High - Low))
Selling = Volume * ((High - Close) / (High - Low))
This calculation determines the volume distribution between buying and selling pressure within each bar.
The indicator then calculates the Buying Selling Ratio (BSR) as a percentage using the formula:
BSR = (Buying / (Buying + Selling)) * 100
The BSR value represents the proportion of buying volume relative to the total buying and selling volume.
The BSR is plotted on the chart as a line, with colors indicating different market conditions:
If the BSR is above the overbought level (defined as 90 in this example), the line is displayed in red.
If the BSR is below the oversold level (defined as 10 in this example), the line is displayed in green.
Otherwise, the line is displayed in blue.
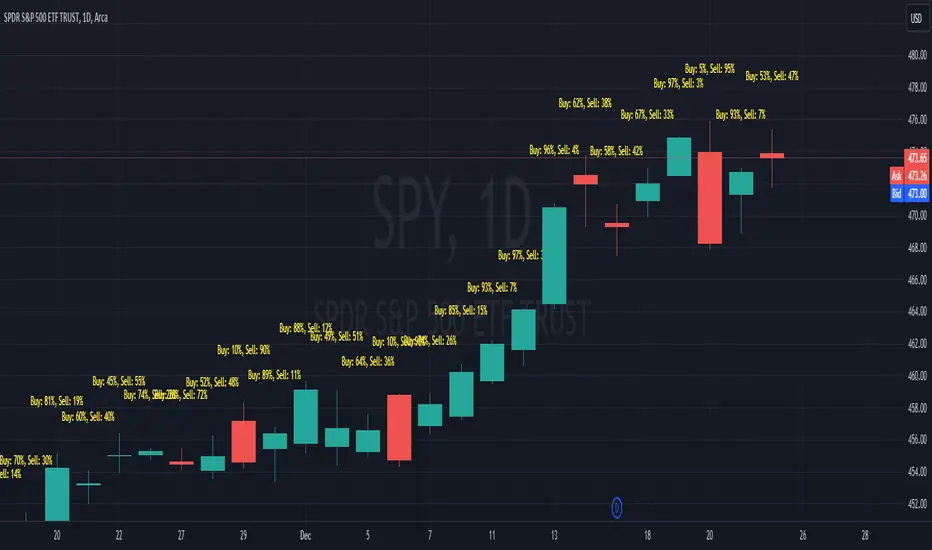
Additionally, the indicator includes labels above each bar to show the buying and selling percentages for that specific bar. The labels display the text "Buy: X%, Sell: Y%", where X represents the percentage of buying volume and Y represents the percentage of selling volume for the given bar.
By enabling the "Show Past Labels" option, the indicator displays labels for previous bars. Otherwise, it only displays the label for the latest bar.
Overall, the indicator provides insights into buying and selling pressures and their relative strengths based on volume analysis.
The "Buying Selling Ratio with Label" indicator calculates and displays the buying and selling ratio based on volume and price movements. Here's a description of its functionality:
The indicator calculates the buying and selling volumes using the formula:
Buying = Volume * ((Close - Low) / (High - Low))
Selling = Volume * ((High - Close) / (High - Low))
This calculation determines the volume distribution between buying and selling pressure within each bar.
The indicator then calculates the Buying Selling Ratio (BSR) as a percentage using the formula:
BSR = (Buying / (Buying + Selling)) * 100
The BSR value represents the proportion of buying volume relative to the total buying and selling volume.
The BSR is plotted on the chart as a line, with colors indicating different market conditions:
If the BSR is above the overbought level (defined as 90 in this example), the line is displayed in red.
If the BSR is below the oversold level (defined as 10 in this example), the line is displayed in green.
Otherwise, the line is displayed in blue.
Additionally, the indicator includes labels above each bar to show the buying and selling percentages for that specific bar. The labels display the text "Buy: X%, Sell: Y%", where X represents the percentage of buying volume and Y represents the percentage of selling volume for the given bar.
By enabling the "Show Past Labels" option, the indicator displays labels for previous bars. Otherwise, it only displays the label for the latest bar.
Overall, the indicator provides insights into buying and selling pressures and their relative strengths based on volume analysis.
เอกสารเผยแพร่
//updateสคริปต์โอเพนซอร์ซ
ด้วยเจตนารมณ์หลักของ TradingView ผู้สร้างสคริปต์นี้ได้ทำให้เป็นโอเพนซอร์ส เพื่อให้เทรดเดอร์สามารถตรวจสอบและยืนยันฟังก์ชันการทำงานของมันได้ ขอชื่นชมผู้เขียน! แม้ว่าคุณจะใช้งานได้ฟรี แต่โปรดจำไว้ว่าการเผยแพร่โค้ดซ้ำจะต้องเป็นไปตาม กฎระเบียบการใช้งาน ของเรา
คำจำกัดสิทธิ์ความรับผิดชอบ
ข้อมูลและบทความไม่ได้มีวัตถุประสงค์เพื่อก่อให้เกิดกิจกรรมทางการเงิน, การลงทุน, การซื้อขาย, ข้อเสนอแนะ หรือคำแนะนำประเภทอื่น ๆ ที่ให้หรือรับรองโดย TradingView อ่านเพิ่มเติมใน ข้อกำหนดการใช้งาน
สคริปต์โอเพนซอร์ซ
ด้วยเจตนารมณ์หลักของ TradingView ผู้สร้างสคริปต์นี้ได้ทำให้เป็นโอเพนซอร์ส เพื่อให้เทรดเดอร์สามารถตรวจสอบและยืนยันฟังก์ชันการทำงานของมันได้ ขอชื่นชมผู้เขียน! แม้ว่าคุณจะใช้งานได้ฟรี แต่โปรดจำไว้ว่าการเผยแพร่โค้ดซ้ำจะต้องเป็นไปตาม กฎระเบียบการใช้งาน ของเรา
คำจำกัดสิทธิ์ความรับผิดชอบ
ข้อมูลและบทความไม่ได้มีวัตถุประสงค์เพื่อก่อให้เกิดกิจกรรมทางการเงิน, การลงทุน, การซื้อขาย, ข้อเสนอแนะ หรือคำแนะนำประเภทอื่น ๆ ที่ให้หรือรับรองโดย TradingView อ่านเพิ่มเติมใน ข้อกำหนดการใช้งาน