OPEN-SOURCE SCRIPT
real (colored) volume
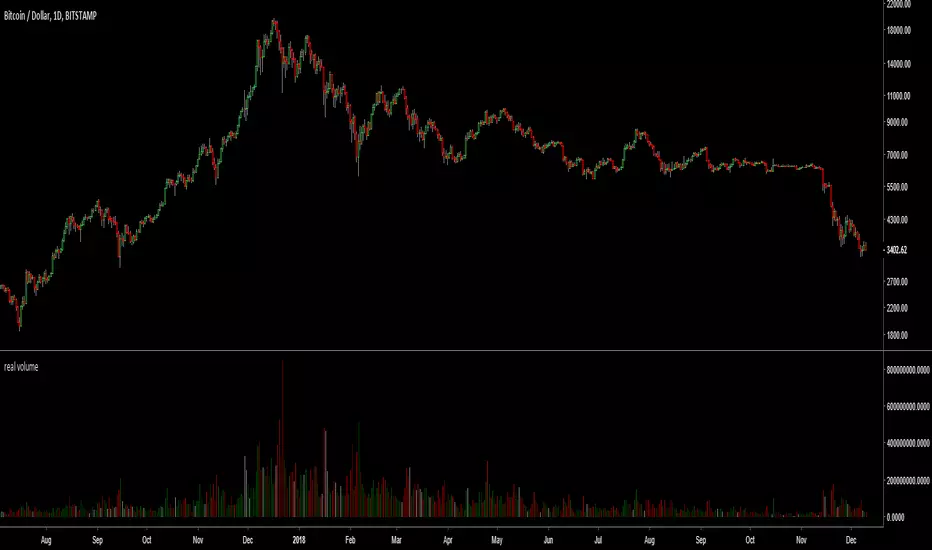
This script plots the volume in terms of the underlying base (e.g. USD or btc) not number of coins traded. It plots volume*mid price.
In addition, the volume color density depends on the candle body divided to high-low. Very green for long up candle body, grey means short candle body compared to high-low, very red for long down candle body. It may provide some indications of the strength of bulls versus bears.
In addition, the volume color density depends on the candle body divided to high-low. Very green for long up candle body, grey means short candle body compared to high-low, very red for long down candle body. It may provide some indications of the strength of bulls versus bears.
สคริปต์โอเพนซอร์ซ
ด้วยเจตนารมณ์หลักของ TradingView ผู้สร้างสคริปต์นี้ได้ทำให้เป็นโอเพนซอร์ส เพื่อให้เทรดเดอร์สามารถตรวจสอบและยืนยันฟังก์ชันการทำงานของมันได้ ขอชื่นชมผู้เขียน! แม้ว่าคุณจะใช้งานได้ฟรี แต่โปรดจำไว้ว่าการเผยแพร่โค้ดซ้ำจะต้องเป็นไปตาม กฎระเบียบการใช้งาน ของเรา
คำจำกัดสิทธิ์ความรับผิดชอบ
ข้อมูลและบทความไม่ได้มีวัตถุประสงค์เพื่อก่อให้เกิดกิจกรรมทางการเงิน, การลงทุน, การซื้อขาย, ข้อเสนอแนะ หรือคำแนะนำประเภทอื่น ๆ ที่ให้หรือรับรองโดย TradingView อ่านเพิ่มเติมใน ข้อกำหนดการใช้งาน