OPEN-SOURCE SCRIPT
Green Dot with Lower BB Touch
This code is based on Dr. Wish's Green Dot indicator and all credits should go to him for this indicator. I have adapted the code described by Dr. Wish in his various blog posts and webinars.
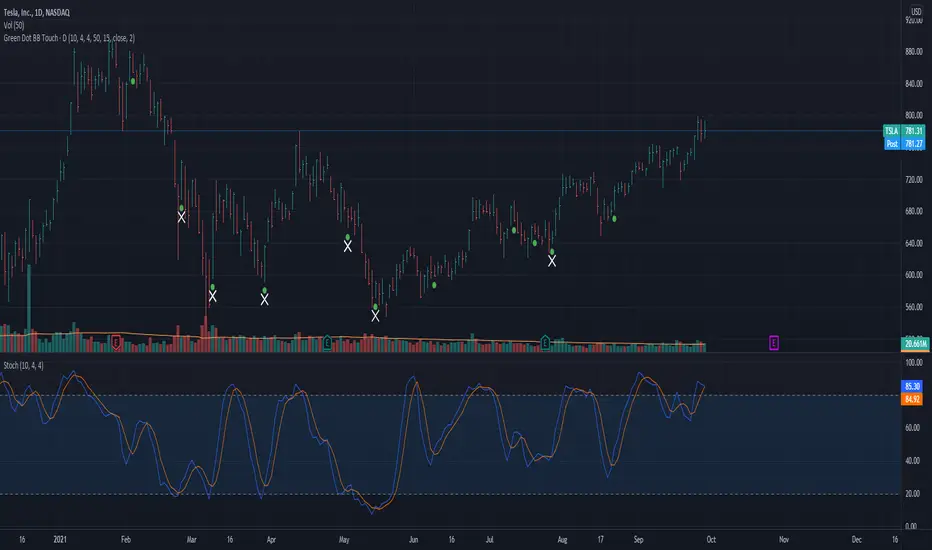
This indicator involves Stochastics and Bollinger Band indicators to provide an indication when a technically sound stock is potentially oversold and reading to resume its uptrend. This is best used in Stage 2 (Weinstein) stocks viewed on a daily chart.
The green dot appears when the fast stochastic recently crosses over the slow stochastic at the oversold (OS) threshold.
The default values for this Stochastic are 10,4,4 with an oversold (OS) threshold of 50. You can add the built-in Stochastic indicator to check this out and have a better visual as to why this works.
An added enhancement is using Bollinger Bands, specifically when the price has crossed the lower band in the past 3 days. The also plays into the themes of stocks that are following an uptrend.
The default values for the Bollinger Band portion of the indicator is a length of 15 with a standard deviation of using the stock's closing price.
I have compared this indicator with the many examples from Dr. Wish's blog and feel free to do the same to make sure it is in agreement.
I welcome your feedback and any enhancements you may suggest.
สคริปต์โอเพนซอร์ซ
ด้วยเจตนารมณ์หลักของ TradingView ผู้สร้างสคริปต์นี้ได้ทำให้เป็นโอเพนซอร์ส เพื่อให้เทรดเดอร์สามารถตรวจสอบและยืนยันฟังก์ชันการทำงานของมันได้ ขอชื่นชมผู้เขียน! แม้ว่าคุณจะใช้งานได้ฟรี แต่โปรดจำไว้ว่าการเผยแพร่โค้ดซ้ำจะต้องเป็นไปตาม กฎระเบียบการใช้งาน ของเรา
คำจำกัดสิทธิ์ความรับผิดชอบ
ข้อมูลและบทความไม่ได้มีวัตถุประสงค์เพื่อก่อให้เกิดกิจกรรมทางการเงิน, การลงทุน, การซื้อขาย, ข้อเสนอแนะ หรือคำแนะนำประเภทอื่น ๆ ที่ให้หรือรับรองโดย TradingView อ่านเพิ่มเติมใน ข้อกำหนดการใช้งาน