PROTECTED SOURCE SCRIPT
Seasonality normalized

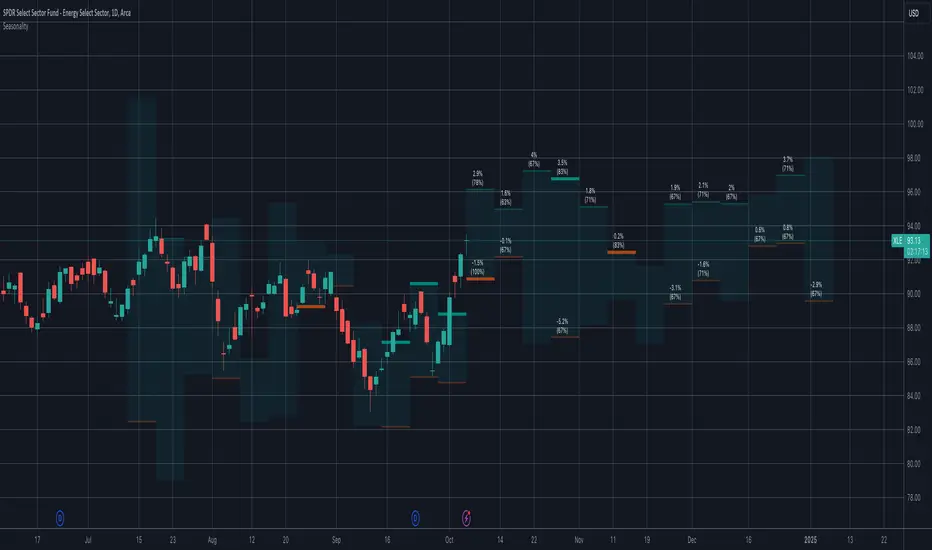
This custom indicator provides an in-depth analysis of historical price performance to identify potential seasonal patterns and correlations. By examining data from the past 10 years, the indicator filters out outlier performances and focuses on the most consistent seasonal trends.
Key Features:
Under the Hood:
This indicator is designed to help professional traders identify and capitalize on seasonal patterns in the market. By providing a robust and adaptable framework for analyzing historical performance, the Seasonality Indicator offers valuable insights for making informed trading decisions.
We believe this tool will be a valuable addition to your trading arsenal, complementing your existing strategies and enhancing your market analysis capabilities. As a professional trader, your feedback and ideas are invaluable to us. Please share your thoughts, experiences, and suggestions for improvement as you incorporate the Seasonality Indicator into your trading workflow. Together, we can refine this powerful tool to better serve the needs of the trading community.
Key Features:
- Intelligent Clustering Algorithm: The indicator employs a custom clustering algorithm to group similar yearly performances together. This approach effectively filters out anomalous years, such as those affected by black swan events like the COVID-19 pandemic, providing a more accurate representation of typical seasonal behavior.
- Seasonal Correlation Measurement: The indicator calculates the percentage of years exhibiting similar performance patterns for each week. This measurement helps traders assess the strength of seasonal correlations and make informed decisions based on the consistency of historical data.
- High and Low Seasonality Bands: The indicator plots two distinct bands on the chart, representing the expected range of price movement based on historical highs and lows. These bands offer valuable insight into potential support and resistance levels during specific weeks.
- Enhanced Visualization: Weeks with high seasonal correlations are prominently highlighted, making it easy for traders to identify periods with the strongest historical patterns. The seasonality bands extend to cover the last and future 3 months, divided into weekly segments, providing a comprehensive view of the current market context.
- Dynamic Adaptation: The seasonality bands are dynamically tied to the current high and low prices, ensuring that the indicator remains relevant and responsive to the latest market conditions.
Under the Hood:
- The indicator begins by calculating the performance of the asset for each week, going back 10 years.
- The custom clustering algorithm groups similar performances together, effectively filtering out outlier years.
- The percentage of years falling into the largest performance cluster is calculated, representing the seasonal correlation for each week.
- The average performance of the largest cluster is used to plot the high and low seasonality bands, anchored to the current high and low prices.
- The bands are color-coded based on the strength of the seasonal correlation, with darker colors indicating higher consistency.
This indicator is designed to help professional traders identify and capitalize on seasonal patterns in the market. By providing a robust and adaptable framework for analyzing historical performance, the Seasonality Indicator offers valuable insights for making informed trading decisions.
We believe this tool will be a valuable addition to your trading arsenal, complementing your existing strategies and enhancing your market analysis capabilities. As a professional trader, your feedback and ideas are invaluable to us. Please share your thoughts, experiences, and suggestions for improvement as you incorporate the Seasonality Indicator into your trading workflow. Together, we can refine this powerful tool to better serve the needs of the trading community.
สคริปต์ที่ได้รับการป้องกัน
สคริปต์นี้ถูกเผยแพร่เป็นแบบ closed-source อย่างไรก็ตาม คุณสามารถใช้ได้อย่างอิสระและไม่มีข้อจำกัดใดๆ – เรียนรู้เพิ่มเติมได้ที่นี่
Dmytro S.
คำจำกัดสิทธิ์ความรับผิดชอบ
ข้อมูลและบทความไม่ได้มีวัตถุประสงค์เพื่อก่อให้เกิดกิจกรรมทางการเงิน, การลงทุน, การซื้อขาย, ข้อเสนอแนะ หรือคำแนะนำประเภทอื่น ๆ ที่ให้หรือรับรองโดย TradingView อ่านเพิ่มเติมใน ข้อกำหนดการใช้งาน