OPEN-SOURCE SCRIPT
ที่อัปเดต: Bitcoin Risk Metric II
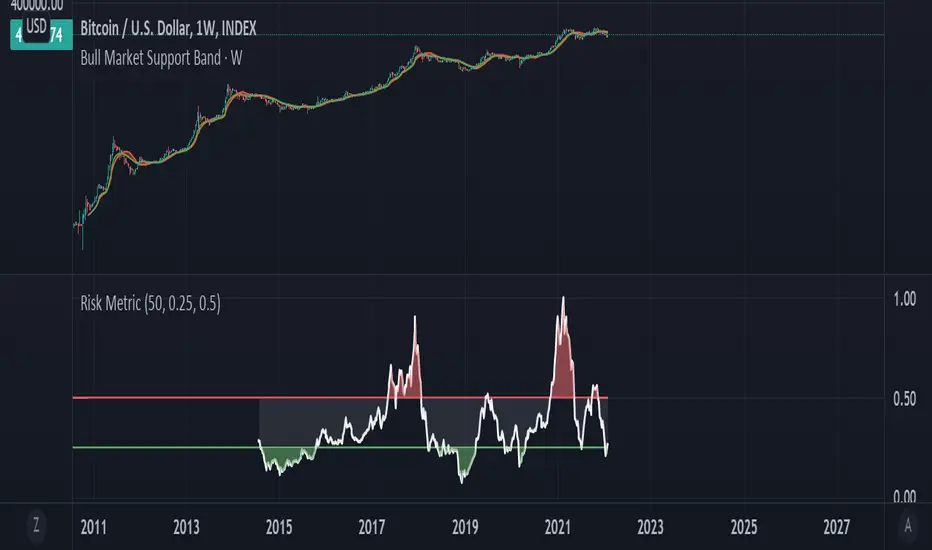
Thesis: Bitcoin's price movements can be (dubiously) characterized by functional relationships between moving averages and standard deviations. These movements can be normalized into a risk metric through normalization functions of time. This risk metric may be able to quantify a long term "buy low, sell high" strategy.
This risk metric is the average of three normalized metrics:
1. (btc - 4 yma)/ (std dev)
2. ln(btc / 20 wma)
3. (50 dma)/(50 wma)
* btc = btc price
* yma = yearly moving average of btc, wma = weekly moving average of btc, dma = daily moving average of btc
* std dev = std dev of btc
Important note:
Historical data for this metric is only shown back until 2014, because of the nature of the 1st mentioned metric. The other two metrics produce a value back until 2011. A previous, less robust, version of metric 2 is posted on my TradingView as well.
เอกสารเผยแพร่
Tidied up code. สคริปต์โอเพนซอร์ซ
ด้วยเจตนารมณ์หลักของ TradingView ผู้สร้างสคริปต์นี้ได้ทำให้เป็นโอเพนซอร์ส เพื่อให้เทรดเดอร์สามารถตรวจสอบและยืนยันฟังก์ชันการทำงานของมันได้ ขอชื่นชมผู้เขียน! แม้ว่าคุณจะใช้งานได้ฟรี แต่โปรดจำไว้ว่าการเผยแพร่โค้ดซ้ำจะต้องเป็นไปตาม กฎระเบียบการใช้งาน ของเรา
คำจำกัดสิทธิ์ความรับผิดชอบ
ข้อมูลและบทความไม่ได้มีวัตถุประสงค์เพื่อก่อให้เกิดกิจกรรมทางการเงิน, การลงทุน, การซื้อขาย, ข้อเสนอแนะ หรือคำแนะนำประเภทอื่น ๆ ที่ให้หรือรับรองโดย TradingView อ่านเพิ่มเติมใน ข้อกำหนดการใช้งาน
สคริปต์โอเพนซอร์ซ
ด้วยเจตนารมณ์หลักของ TradingView ผู้สร้างสคริปต์นี้ได้ทำให้เป็นโอเพนซอร์ส เพื่อให้เทรดเดอร์สามารถตรวจสอบและยืนยันฟังก์ชันการทำงานของมันได้ ขอชื่นชมผู้เขียน! แม้ว่าคุณจะใช้งานได้ฟรี แต่โปรดจำไว้ว่าการเผยแพร่โค้ดซ้ำจะต้องเป็นไปตาม กฎระเบียบการใช้งาน ของเรา
คำจำกัดสิทธิ์ความรับผิดชอบ
ข้อมูลและบทความไม่ได้มีวัตถุประสงค์เพื่อก่อให้เกิดกิจกรรมทางการเงิน, การลงทุน, การซื้อขาย, ข้อเสนอแนะ หรือคำแนะนำประเภทอื่น ๆ ที่ให้หรือรับรองโดย TradingView อ่านเพิ่มเติมใน ข้อกำหนดการใช้งาน