OPEN-SOURCE SCRIPT
Vertical and Horizontal Lines on given Dates

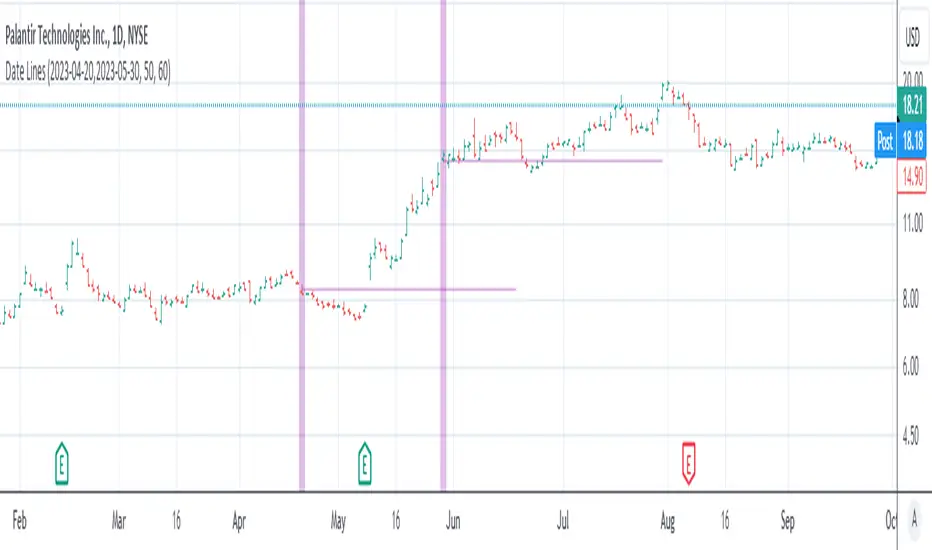
This simple indicator is to show the impact of given dates on the chart:
The dates need to be entered in a yyyy-MM-dd format, separated by comma (,) or space+comma ( ,).
The event can be shown on the chart with a vertical highlighting.
The midpoint of the price action that day can be shown as a vertical line.
Hint: If you load a lot of dates into it, best disable the "Indicator Arguments" in "Chart Settings" -> "Status line" to not have the chart littered with these date arguments.
สคริปต์โอเพนซอร์ซ
ด้วยเจตนารมณ์หลักของ TradingView ผู้สร้างสคริปต์นี้ได้ทำให้เป็นโอเพนซอร์ส เพื่อให้เทรดเดอร์สามารถตรวจสอบและยืนยันฟังก์ชันการทำงานของมันได้ ขอชื่นชมผู้เขียน! แม้ว่าคุณจะใช้งานได้ฟรี แต่โปรดจำไว้ว่าการเผยแพร่โค้ดซ้ำจะต้องเป็นไปตาม กฎระเบียบการใช้งาน ของเรา
คำจำกัดสิทธิ์ความรับผิดชอบ
ข้อมูลและบทความไม่ได้มีวัตถุประสงค์เพื่อก่อให้เกิดกิจกรรมทางการเงิน, การลงทุน, การซื้อขาย, ข้อเสนอแนะ หรือคำแนะนำประเภทอื่น ๆ ที่ให้หรือรับรองโดย TradingView อ่านเพิ่มเติมใน ข้อกำหนดการใช้งาน