PROTECTED SOURCE SCRIPT
ที่อัปเดต: sharp mpz
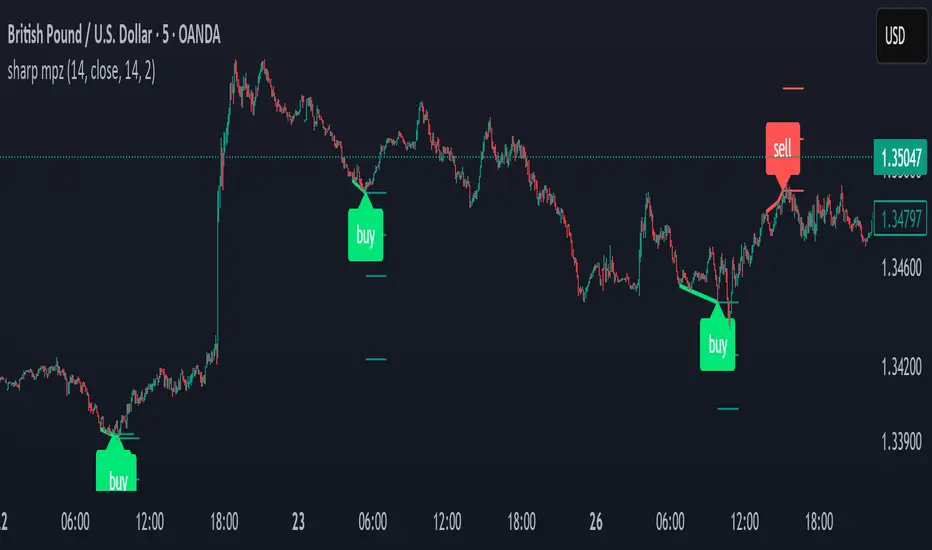
Identifying divergence (triple peaks and triple valleys) with RSI.
เอกสารเผยแพร่
Identifying divergence (triple peaks and triple valleys) with RSI.เอกสารเผยแพร่
This indicator detects divergences. Specifically, it looks for a type of triple divergence between price and the Relative Strength Index (RSI) to issue buy or sell signals.By analyzing the relationship between price movement (high and low pivot points) and the RSI oscillator, this indicator seeks out trading opportunities. Its core logic is to find a specific pattern of three consecutive pivot points where the price is making higher highs (for a bearish signal) or lower lows (for a bullish signal), while the RSI is simultaneously forming lower highs or higher lows, respectively.
สคริปต์ที่ได้รับการป้องกัน
สคริปต์นี้ถูกเผยแพร่เป็นแบบ closed-source อย่างไรก็ตาม คุณสามารถใช้ได้อย่างอิสระและไม่มีข้อจำกัดใดๆ – เรียนรู้เพิ่มเติมได้ที่นี่
คำจำกัดสิทธิ์ความรับผิดชอบ
ข้อมูลและบทความไม่ได้มีวัตถุประสงค์เพื่อก่อให้เกิดกิจกรรมทางการเงิน, การลงทุน, การซื้อขาย, ข้อเสนอแนะ หรือคำแนะนำประเภทอื่น ๆ ที่ให้หรือรับรองโดย TradingView อ่านเพิ่มเติมใน ข้อกำหนดการใช้งาน