PROTECTED SOURCE SCRIPT
TrendFlow
The TrendFlow_VolHub is a clean, trend-following indicator built on a simple yet effective core of Exponential Moving Averages (EMAs). It provides clear visual cues for trend direction, volatility, and key support/resistance levels.
Key Features
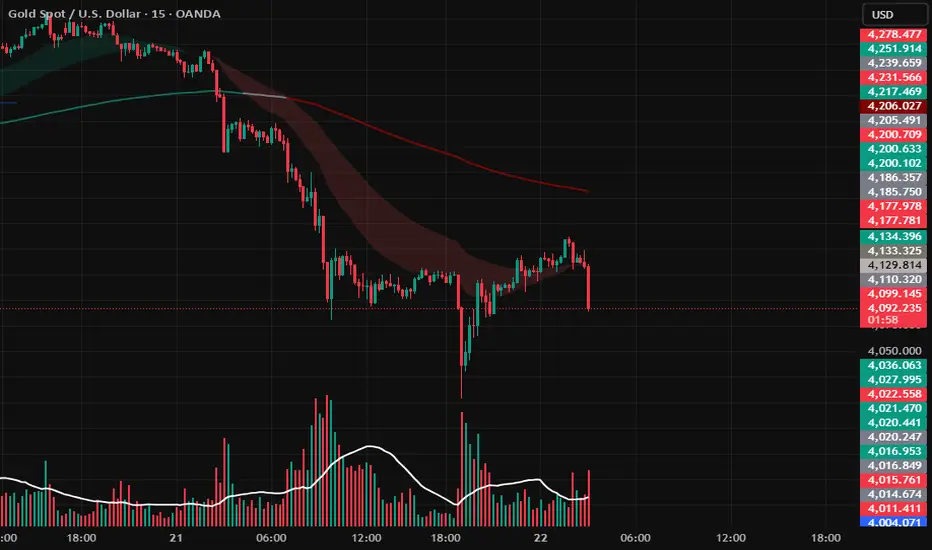
Dynamic EMA Ribbon (21/50):
The area between the EMA 21 and EMA 50 is filled with color to clearly visualize the short-term trend momentum.
Green Fill: EMA 21 is above EMA 50 (Bullish Momentum).
Red Fill: EMA 21 is below EMA 50 (Bearish Momentum).
A user-adjustable Fill Opacity input (0-100) is included for customization.
Dynamic EMA 200 (Long-Term Filter):
The EMA 200 serves as a powerful long-term trend filter and major support/resistance.
Its color dynamically changes based on its position relative to the EMA 21 and EMA 50:
Teal/Green: EMA 200 is below both the 21 and 50 (Strong Bullish Alignment).
Red/Maroon: EMA 200 is above both the 21 and 50 (Strong Bearish Alignment).
Gray: The EMAs are crossing or choppy (Neutral/Consolidation).
Suggested Use
Trend Confirmation: Use the Ribbon color (Green/Red) to confirm the immediate directional bias.
Trend Strength: Use the EMA 200 color as a high-level filter. A bullish ribbon (green) combined with a teal/green 200 EMA suggests a high-conviction uptrend.
Dynamic S/R: The EMA lines themselves can be used as dynamic support and resistance levels.
Key Features
Dynamic EMA Ribbon (21/50):
The area between the EMA 21 and EMA 50 is filled with color to clearly visualize the short-term trend momentum.
Green Fill: EMA 21 is above EMA 50 (Bullish Momentum).
Red Fill: EMA 21 is below EMA 50 (Bearish Momentum).
A user-adjustable Fill Opacity input (0-100) is included for customization.
Dynamic EMA 200 (Long-Term Filter):
The EMA 200 serves as a powerful long-term trend filter and major support/resistance.
Its color dynamically changes based on its position relative to the EMA 21 and EMA 50:
Teal/Green: EMA 200 is below both the 21 and 50 (Strong Bullish Alignment).
Red/Maroon: EMA 200 is above both the 21 and 50 (Strong Bearish Alignment).
Gray: The EMAs are crossing or choppy (Neutral/Consolidation).
Suggested Use
Trend Confirmation: Use the Ribbon color (Green/Red) to confirm the immediate directional bias.
Trend Strength: Use the EMA 200 color as a high-level filter. A bullish ribbon (green) combined with a teal/green 200 EMA suggests a high-conviction uptrend.
Dynamic S/R: The EMA lines themselves can be used as dynamic support and resistance levels.
สคริปต์ที่ได้รับการป้องกัน
สคริปต์นี้ถูกเผยแพร่เป็นแบบ closed-source อย่างไรก็ตาม คุณสามารถใช้ได้อย่างอิสระและไม่มีข้อจำกัดใดๆ – เรียนรู้เพิ่มเติมได้ที่นี่
คำจำกัดสิทธิ์ความรับผิดชอบ
ข้อมูลและบทความไม่ได้มีวัตถุประสงค์เพื่อก่อให้เกิดกิจกรรมทางการเงิน, การลงทุน, การซื้อขาย, ข้อเสนอแนะ หรือคำแนะนำประเภทอื่น ๆ ที่ให้หรือรับรองโดย TradingView อ่านเพิ่มเติมที่ ข้อกำหนดการใช้งาน