OPEN-SOURCE SCRIPT
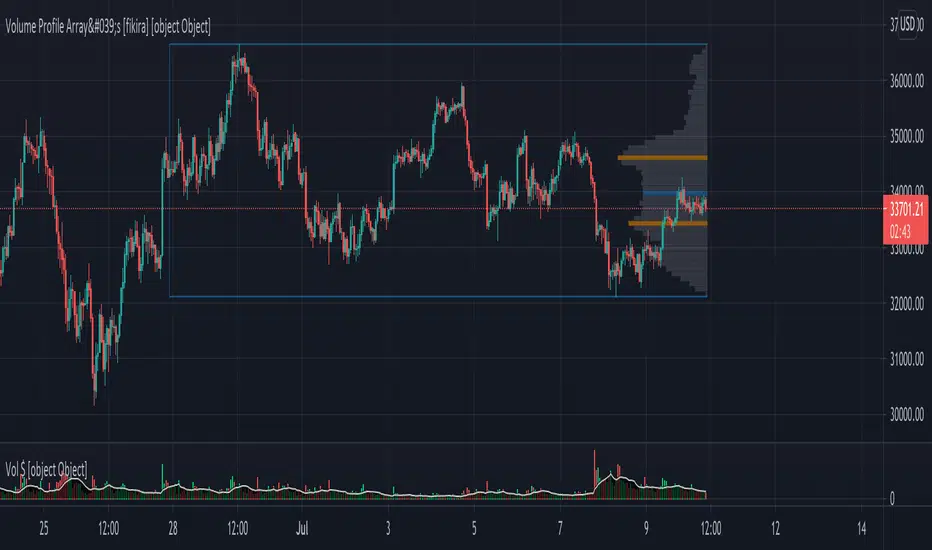
ที่อัปเดต: Volume Profile Array's [fikira]
Inspired by © IldarAkhmetgaleev (AkhIL) - "Poor man's volume profile" - "PMVolProf"
He did a fantastic job on "Volume Profile"!
My script is about making this with array's
Settings:
- period (last x bars) for calculation
- max width (visible horizontal range)
- amount of sections (vertical sections; to many sections can give an error -> lower the sections in that case)
Setting "high/low", "close":
- "high/low"
-> the volume of every bar (in the period) which low is lower than a particular section and which high is higher than that section is added to that section
- "close"
-> here the volume of every bar (in the period) which close closes in the range of a particular section is added to that section
The orange/blue coloured "Volume lines" are the highest/lowest values above and below present close
(can be used as Support/resistance )
"Only show max/min" shows only the orange/blue Volume lines
The period and highest/lowest is show by 2 thin blue lines
Color, line width is adjustable
Cheers!
เอกสารเผยแพร่
Changed colour logic:Now you can compare each section with #sections above/below for the max/min
(min 1 and max 5 sections above/below to compare with)
"compare # sections above/below for max/min" = 1:
"compare # sections above/below for max/min" = 3:
"compare # sections above/below for max/min" = 5:
Also added vertical line where the bar calculations start
สคริปต์โอเพนซอร์ซ
ด้วยเจตนารมณ์หลักของ TradingView ผู้สร้างสคริปต์นี้ได้ทำให้เป็นโอเพนซอร์ส เพื่อให้เทรดเดอร์สามารถตรวจสอบและยืนยันฟังก์ชันการทำงานของมันได้ ขอชื่นชมผู้เขียน! แม้ว่าคุณจะใช้งานได้ฟรี แต่โปรดจำไว้ว่าการเผยแพร่โค้ดซ้ำจะต้องเป็นไปตาม กฎระเบียบการใช้งาน ของเรา
Who are PineCoders?
tradingview.com/chart/SSP/yW5eOqtm-Who-are-PineCoders/
TG Pine Script® Q&A: t.me/PineCodersQA
- We cannot control our emotions,
but we can control our keyboard -
tradingview.com/chart/SSP/yW5eOqtm-Who-are-PineCoders/
TG Pine Script® Q&A: t.me/PineCodersQA
- We cannot control our emotions,
but we can control our keyboard -
คำจำกัดสิทธิ์ความรับผิดชอบ
ข้อมูลและบทความไม่ได้มีวัตถุประสงค์เพื่อก่อให้เกิดกิจกรรมทางการเงิน, การลงทุน, การซื้อขาย, ข้อเสนอแนะ หรือคำแนะนำประเภทอื่น ๆ ที่ให้หรือรับรองโดย TradingView อ่านเพิ่มเติมใน ข้อกำหนดการใช้งาน