OPEN-SOURCE SCRIPT
Volume Aggregated (Lite)

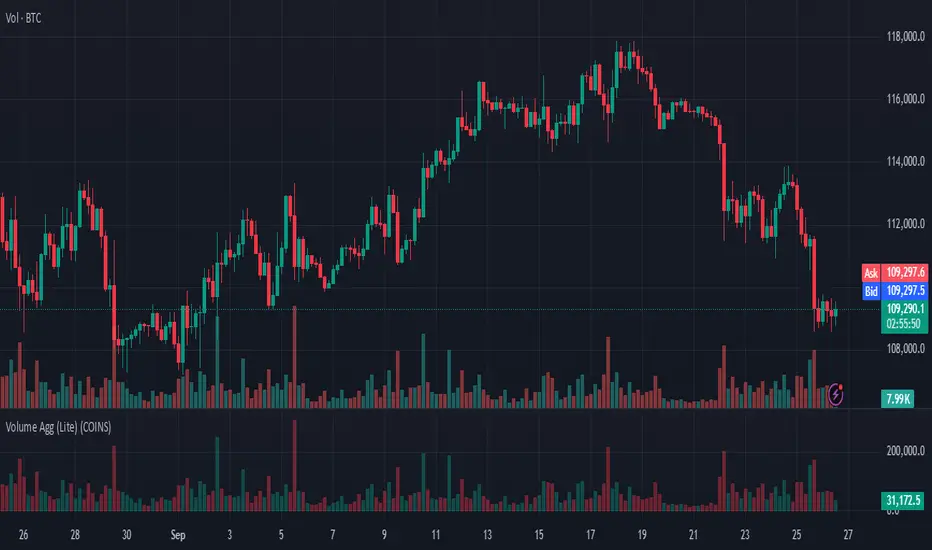
Volume Aggregated (Lite) is a lightweight yet powerful tool designed to provide traders with a consolidated view of trading volume across major perpetual futures markets. Instead of relying solely on the volume of a single exchange, this indicator aggregates and normalizes data from multiple venues, giving a broader and more representative measure of market activity.
Supported Exchanges:
Binance (USDT.P & USDC.P)
Bybit (USDT.P & USD.P)
OKX (USDT.P & USD.P)
Bitget (USDT.P & USD.P)
Coinbase (USDC.P)
Users can toggle each exchange individually, allowing flexible customization depending on which markets they consider most relevant.
Denomination Options:
COINS: Volume expressed in the base currency (e.g., BTC, ETH).
USD: Volume normalized to USD values by multiplying with price.
Why it’s useful:
Volume is a critical component of technical analysis, reflecting market participation and conviction behind price moves. However, relying on a single exchange can create blind spots, especially in crypto where liquidity is fragmented. By combining data from multiple large exchanges, this indicator offers:
A more comprehensive measure of market interest.
A normalized comparison between exchanges with different quote currencies (e.g., USDT, USD, USDC).
A volume stream that can be used as a custom source for other indicators, strategies, or overlays within TradingView.
Practical Applications:
Trend Confirmation: Check if aggregated volume supports price direction.
Breakout Validation: Identify whether breakouts are backed by broad participation across venues.
Divergence Detection: Spot situations where price moves without sufficient cross-exchange volume.
Custom Indicator Input: Since it outputs a clean series, it can be plugged into moving averages, oscillators, or custom-built scripts.
Technical Details:
The script uses request.security() to pull volume data across exchanges and normalizes values when required (e.g., USD-quoted pairs divided by the instrument’s price). It then aggregates all valid inputs into a single stream. The result is displayed as color-coded columns (green for bullish candles, red for bearish), making it easy to interpret at a glance.
This “Lite” version keeps the focus on core functionality: aggregation, normalization, and straightforward visualization—avoiding unnecessary complexity while remaining highly adaptable for custom analysis.
สคริปต์โอเพนซอร์ซ
ด้วยเจตนารมณ์หลักของ TradingView ผู้สร้างสคริปต์นี้ได้ทำให้เป็นโอเพนซอร์ส เพื่อให้เทรดเดอร์สามารถตรวจสอบและยืนยันฟังก์ชันการทำงานของมันได้ ขอชื่นชมผู้เขียน! แม้ว่าคุณจะใช้งานได้ฟรี แต่โปรดจำไว้ว่าการเผยแพร่โค้ดซ้ำจะต้องเป็นไปตาม กฎระเบียบการใช้งาน ของเรา
คำจำกัดสิทธิ์ความรับผิดชอบ
ข้อมูลและบทความไม่ได้มีวัตถุประสงค์เพื่อก่อให้เกิดกิจกรรมทางการเงิน, การลงทุน, การซื้อขาย, ข้อเสนอแนะ หรือคำแนะนำประเภทอื่น ๆ ที่ให้หรือรับรองโดย TradingView อ่านเพิ่มเติมใน ข้อกำหนดการใช้งาน