OPEN-SOURCE SCRIPT
Orion:Supertrend Hybrid
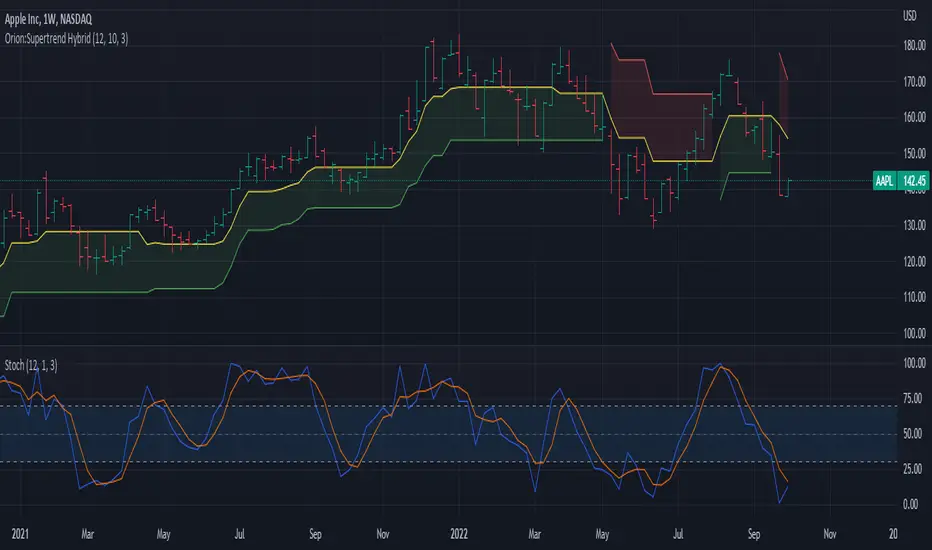
Supertrend Hybrid
This indicator is a combination of the Supertrend and Donchian Channels.
The original Supertrend indicator shades the area from the mean (hl2) of the bar/candle to the Supertrend line.
This Hybrid uses the mid section of the Donchian channel to the Supertrend line as the area to be shaded.
This provides a visual of when prices are getting close to potentially reversing the trend.
Values:
Length = Length of the Donchian Channels (Default: 12)
ATR Length = Lookback length of the ATR calculation (Default: 10)
Factor = Multiply the ATR by this value to get a trend reversal value (Default: 3.0)
Prices cross above the red line indicating a bullish trend is in play
Prices cross below the green line indicating a bearish trend is in play
Yellow line represents the mid-section of the Donchian Channel.
Suggested usage:
Add a Stochastic and set the Stochastic %K Length to the same value as the Donchian Length.
When below trend (red line dominate) and prices cross into the shaded area, if stochastic crosses above 70, prices may challenge/cross the red trend line.
When above trend (green line dominate) and prices cross into the shaded area, if stochastic crosses below 30, prices may challenge/cross the green trend line.
IF in an up trend (green line dominate) and stochastic crosses/remains above 70, potential higher price movement exists.
IF in an down trend (red line dominate) and stochastic crosses/remains below 30, potential lower price movement exists.
สคริปต์โอเพนซอร์ซ
ด้วยเจตนารมณ์หลักของ TradingView ผู้สร้างสคริปต์นี้ได้ทำให้เป็นโอเพนซอร์ส เพื่อให้เทรดเดอร์สามารถตรวจสอบและยืนยันฟังก์ชันการทำงานของมันได้ ขอชื่นชมผู้เขียน! แม้ว่าคุณจะใช้งานได้ฟรี แต่โปรดจำไว้ว่าการเผยแพร่โค้ดซ้ำจะต้องเป็นไปตาม กฎระเบียบการใช้งาน ของเรา
คำจำกัดสิทธิ์ความรับผิดชอบ
ข้อมูลและบทความไม่ได้มีวัตถุประสงค์เพื่อก่อให้เกิดกิจกรรมทางการเงิน, การลงทุน, การซื้อขาย, ข้อเสนอแนะ หรือคำแนะนำประเภทอื่น ๆ ที่ให้หรือรับรองโดย TradingView อ่านเพิ่มเติมใน ข้อกำหนดการใช้งาน