OPEN-SOURCE SCRIPT
ที่อัปเดต: MM Market Range Map
What this script does:
The purpose of this script is to help traders identify when the major sectors of the market are moving in one direction - also known as a "market trend day".
How this script works:
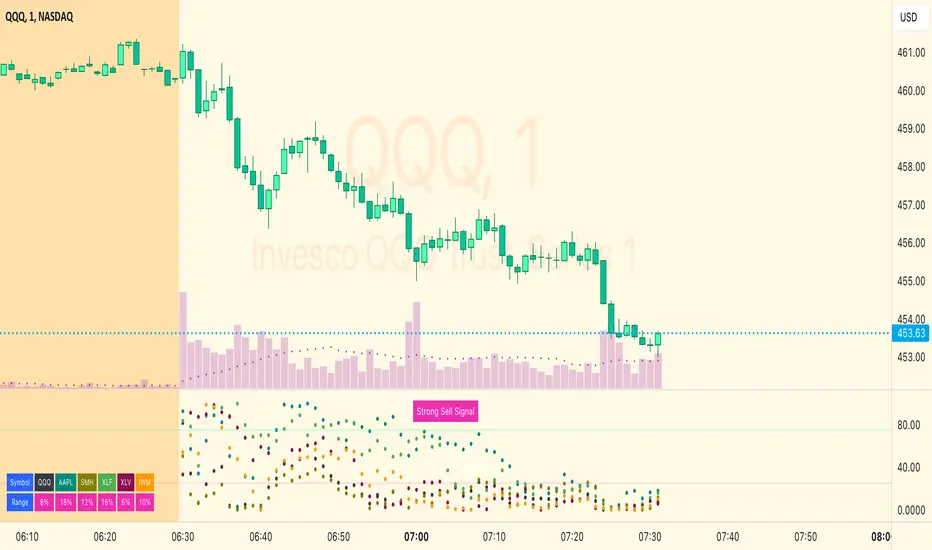
The indicator uses QQQ, SMH and NVDA to represent the technology side of the market, and XLF, XLV & IWM to represent everything else. It tracks where price is within the day's range for each of those symbols, and presents that data in a table and in also in a dot-based "map".
How to use this script:
Using the dot-based map, you can see if all symbols were ever at the highs or lows of their range together. You can use this information to decide which direction you should be trading (ie. with trend). For example, in order for there to be healthy bullish moves in the market, you would want this indicator to show you that all sectors are at the highs or trending in that direction.
What makes this script original:
Most indicators and even the TradingView watchlist measure the percent changed on the day from the closing price of a stock on the prior trading day, essentially telling you what sentiment is since yesterday. This script tells you the sentiment today since it is priced from the opening print. It also provides the map so you can see if they were ever at the highs or lows together throughout the day, which can be an early indicator that the market will trend.
The purpose of this script is to help traders identify when the major sectors of the market are moving in one direction - also known as a "market trend day".
How this script works:
The indicator uses QQQ, SMH and NVDA to represent the technology side of the market, and XLF, XLV & IWM to represent everything else. It tracks where price is within the day's range for each of those symbols, and presents that data in a table and in also in a dot-based "map".
How to use this script:
Using the dot-based map, you can see if all symbols were ever at the highs or lows of their range together. You can use this information to decide which direction you should be trading (ie. with trend). For example, in order for there to be healthy bullish moves in the market, you would want this indicator to show you that all sectors are at the highs or trending in that direction.
What makes this script original:
Most indicators and even the TradingView watchlist measure the percent changed on the day from the closing price of a stock on the prior trading day, essentially telling you what sentiment is since yesterday. This script tells you the sentiment today since it is priced from the opening print. It also provides the map so you can see if they were ever at the highs or lows together throughout the day, which can be an early indicator that the market will trend.
เอกสารเผยแพร่
Updates:- Switched NVDA with AAPL to get a better sense of tech overall (SMH should account for NVDA)
- Added sentiment thresholds & lines for those levels (optionally)
- Added alerts for (a) all sectors at lows, (b) all sectors at highs, and (c) healthy sector rotation
- Added strong buy or sell signal messages
เอกสารเผยแพร่
Added alerts for just QQQ, XLF, XLV at highs/lows. Updating chart.เอกสารเผยแพร่
Fixed a bug where the values didn't display on non-equities charts.เอกสารเผยแพร่
Changed the indicator to allow users to customize or disable the symbols. Had to change the alerts also to account for this change. Now it will only alert when all enabled symbols are at highs or lows.สคริปต์โอเพนซอร์ซ
ด้วยเจตนารมณ์หลักของ TradingView ผู้สร้างสคริปต์นี้ได้ทำให้เป็นโอเพนซอร์ส เพื่อให้เทรดเดอร์สามารถตรวจสอบและยืนยันฟังก์ชันการทำงานของมันได้ ขอชื่นชมผู้เขียน! แม้ว่าคุณจะใช้งานได้ฟรี แต่โปรดจำไว้ว่าการเผยแพร่โค้ดซ้ำจะต้องเป็นไปตาม กฎระเบียบการใช้งาน ของเรา
I release TradingView indicators and libraries designed to make you a better trader. For detailed info about them, head over to improve.trading
คำจำกัดสิทธิ์ความรับผิดชอบ
ข้อมูลและบทความไม่ได้มีวัตถุประสงค์เพื่อก่อให้เกิดกิจกรรมทางการเงิน, การลงทุน, การซื้อขาย, ข้อเสนอแนะ หรือคำแนะนำประเภทอื่น ๆ ที่ให้หรือรับรองโดย TradingView อ่านเพิ่มเติมใน ข้อกำหนดการใช้งาน
สคริปต์โอเพนซอร์ซ
ด้วยเจตนารมณ์หลักของ TradingView ผู้สร้างสคริปต์นี้ได้ทำให้เป็นโอเพนซอร์ส เพื่อให้เทรดเดอร์สามารถตรวจสอบและยืนยันฟังก์ชันการทำงานของมันได้ ขอชื่นชมผู้เขียน! แม้ว่าคุณจะใช้งานได้ฟรี แต่โปรดจำไว้ว่าการเผยแพร่โค้ดซ้ำจะต้องเป็นไปตาม กฎระเบียบการใช้งาน ของเรา
I release TradingView indicators and libraries designed to make you a better trader. For detailed info about them, head over to improve.trading
คำจำกัดสิทธิ์ความรับผิดชอบ
ข้อมูลและบทความไม่ได้มีวัตถุประสงค์เพื่อก่อให้เกิดกิจกรรมทางการเงิน, การลงทุน, การซื้อขาย, ข้อเสนอแนะ หรือคำแนะนำประเภทอื่น ๆ ที่ให้หรือรับรองโดย TradingView อ่านเพิ่มเติมใน ข้อกำหนดการใช้งาน