PROTECTED SOURCE SCRIPT
ที่อัปเดต: UDI Directional Lines 5/20ema
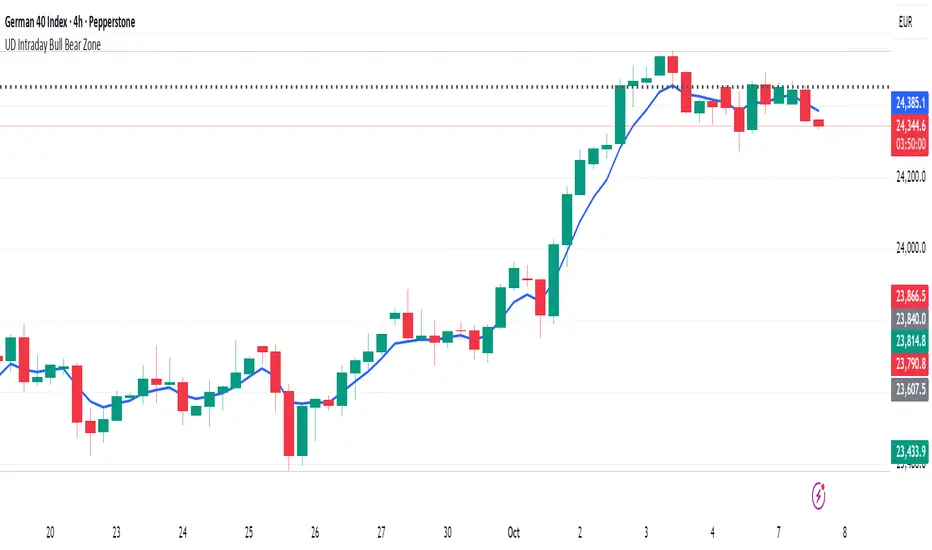
This indicator indicates the use of ema lines to determine the change of directions where:
- 5ema black line indicates small trend shift
- 20ema red line indicates big trend shift
On top of it the circles below the chart shows the momentum to execute where
- green indicates bull trend and cycle
- red indicates red trend and cycle
With the combination of direction and momentum there will be more accuracy in tracking the trend movement of a particular asset
เอกสารเผยแพร่
The blue line is the line that indicates the bull bear zone of the intraday movement where candle closing above is entering Bull and Below is entering Bearสคริปต์ที่ได้รับการป้องกัน
สคริปต์นี้ถูกเผยแพร่เป็นแบบ closed-source อย่างไรก็ตาม คุณสามารถใช้ได้อย่างอิสระและไม่มีข้อจำกัดใดๆ – เรียนรู้เพิ่มเติมได้ที่นี่
Ups and Downs by Entreuverse
คำจำกัดสิทธิ์ความรับผิดชอบ
ข้อมูลและบทความไม่ได้มีวัตถุประสงค์เพื่อก่อให้เกิดกิจกรรมทางการเงิน, การลงทุน, การซื้อขาย, ข้อเสนอแนะ หรือคำแนะนำประเภทอื่น ๆ ที่ให้หรือรับรองโดย TradingView อ่านเพิ่มเติมใน ข้อกำหนดการใช้งาน
สคริปต์ที่ได้รับการป้องกัน
สคริปต์นี้ถูกเผยแพร่เป็นแบบ closed-source อย่างไรก็ตาม คุณสามารถใช้ได้อย่างอิสระและไม่มีข้อจำกัดใดๆ – เรียนรู้เพิ่มเติมได้ที่นี่
Ups and Downs by Entreuverse
คำจำกัดสิทธิ์ความรับผิดชอบ
ข้อมูลและบทความไม่ได้มีวัตถุประสงค์เพื่อก่อให้เกิดกิจกรรมทางการเงิน, การลงทุน, การซื้อขาย, ข้อเสนอแนะ หรือคำแนะนำประเภทอื่น ๆ ที่ให้หรือรับรองโดย TradingView อ่านเพิ่มเติมใน ข้อกำหนดการใช้งาน