PROTECTED SOURCE SCRIPT
MACD MTF

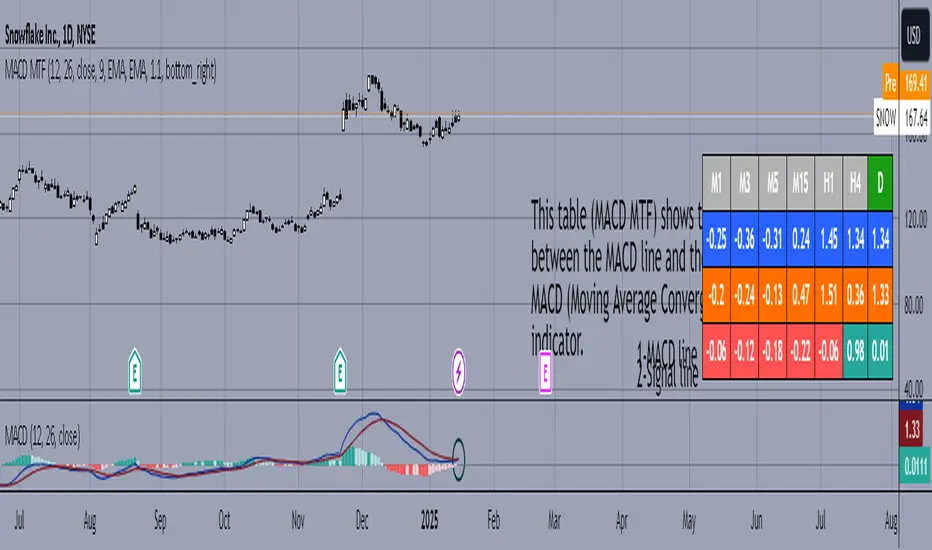
This table is a technical indicator that shows the proximity between the MACD line and the signal line of the multitemporal MACD (Moving Average Convergence Divergence) indicator. When the crossover is bullish, the timeframe will light up in green, and vice versa, if the crossover is bearish, the timeframe will light up in red. With this table, we can save time when detecting opportunities, as with one glance, we can spot potential MACD crossovers (which tend to indicate price action inflection points).
Esta tabla es un indicador técnico que muestra la proximidad entre la línea MACD y la línea de señal del indicador MACD (Moving Average Convergence Divergence) multitemporalmente. Cuando el cruce es alcista la temporalidad se iluminará en verde, y viceversa, si el cruce es bajista la temporalidad se iluminará en rojo. Con esta tabla podremos ahorrar tiempo a la hora de detectar oportunidades, pues de un vistazo podremos detectar posibles cruces de MACD (tienden a señalar puntos de inflexión en la acción de precio)
Esta tabla es un indicador técnico que muestra la proximidad entre la línea MACD y la línea de señal del indicador MACD (Moving Average Convergence Divergence) multitemporalmente. Cuando el cruce es alcista la temporalidad se iluminará en verde, y viceversa, si el cruce es bajista la temporalidad se iluminará en rojo. Con esta tabla podremos ahorrar tiempo a la hora de detectar oportunidades, pues de un vistazo podremos detectar posibles cruces de MACD (tienden a señalar puntos de inflexión en la acción de precio)
สคริปต์ที่ได้รับการป้องกัน
สคริปต์นี้ถูกเผยแพร่เป็นแบบ closed-source อย่างไรก็ตาม คุณสามารถใช้ได้อย่างอิสระและไม่มีข้อจำกัดใดๆ – เรียนรู้เพิ่มเติมได้ที่นี่
📖Revista El Especulador:
drive.google.com/file/d/1Fs8l9xSpZIy5haCb5l0HWzgeAanOifs_/view?usp=drivesdk
👉t.me/ElEspeculador96 (Telegram)
drive.google.com/file/d/1Fs8l9xSpZIy5haCb5l0HWzgeAanOifs_/view?usp=drivesdk
👉t.me/ElEspeculador96 (Telegram)
คำจำกัดสิทธิ์ความรับผิดชอบ
ข้อมูลและบทความไม่ได้มีวัตถุประสงค์เพื่อก่อให้เกิดกิจกรรมทางการเงิน, การลงทุน, การซื้อขาย, ข้อเสนอแนะ หรือคำแนะนำประเภทอื่น ๆ ที่ให้หรือรับรองโดย TradingView อ่านเพิ่มเติมใน ข้อกำหนดการใช้งาน