PROTECTED SOURCE SCRIPT
RED-E Simple Volume Delta
RED-E Simple Volume Delta
A straightforward volume delta indicator designed to help traders identify buying and selling pressure through volume analysis.
Key Features:
- Simple volume delta calculation based on candle direction
- Cumulative delta tracking for trend assessment
- Statistical signal generation using moving averages and standard deviation
- Clean overlay display with customizable dashboard
- Multiple alert conditions for different signal strengths
How It Works:
The indicator measures volume delta by comparing price action:
- Bullish candles (close > open) = positive volume delta (buying pressure)
- Bearish candles (close < open) = negative volume delta (selling pressure)
Signals are generated when volume delta exceeds predefined thresholds based on statistical analysis of recent volume behavior.
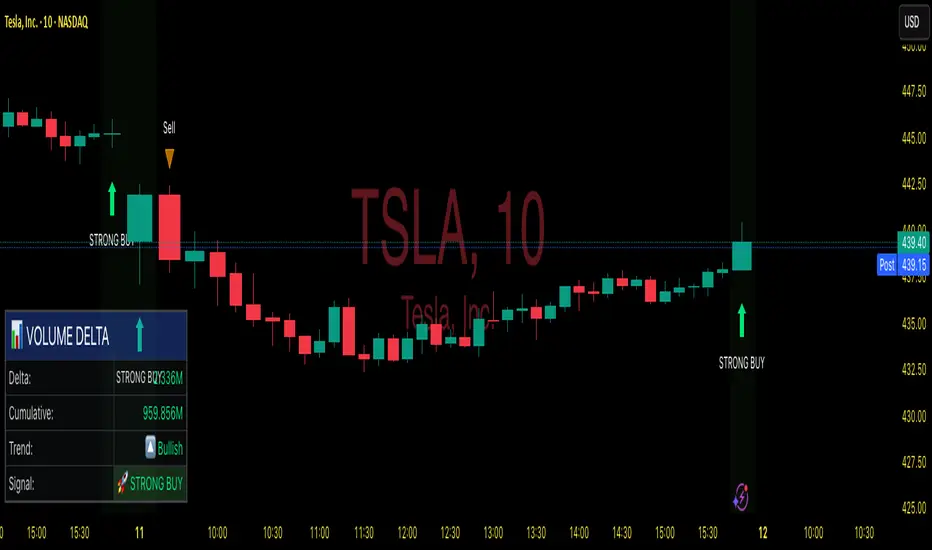
Dashboard Display:
- Current volume delta value
- Cumulative delta total
- Trend direction (Bullish/Bearish)
- Active signal status
Customization Options:
- Lookback Period: Adjusts sensitivity to recent volume changes (default: 14)
- Signal Sensitivity: Controls threshold for signal triggers (range: 0.5 to 5.0)
- Dashboard Size: Small, Normal, or Huge
- Dashboard Position: 9 placement options
Educational Purpose:
This tool is designed for educational and analytical purposes. It should be used as part of a comprehensive trading strategy alongside other technical and fundamental analysis methods.
Disclaimer: Trading involves substantial risk. This indicator does not guarantee profitable trades. Always perform your own analysis and risk management.
A straightforward volume delta indicator designed to help traders identify buying and selling pressure through volume analysis.
Key Features:
- Simple volume delta calculation based on candle direction
- Cumulative delta tracking for trend assessment
- Statistical signal generation using moving averages and standard deviation
- Clean overlay display with customizable dashboard
- Multiple alert conditions for different signal strengths
How It Works:
The indicator measures volume delta by comparing price action:
- Bullish candles (close > open) = positive volume delta (buying pressure)
- Bearish candles (close < open) = negative volume delta (selling pressure)
Signals are generated when volume delta exceeds predefined thresholds based on statistical analysis of recent volume behavior.
Dashboard Display:
- Current volume delta value
- Cumulative delta total
- Trend direction (Bullish/Bearish)
- Active signal status
Customization Options:
- Lookback Period: Adjusts sensitivity to recent volume changes (default: 14)
- Signal Sensitivity: Controls threshold for signal triggers (range: 0.5 to 5.0)
- Dashboard Size: Small, Normal, or Huge
- Dashboard Position: 9 placement options
Educational Purpose:
This tool is designed for educational and analytical purposes. It should be used as part of a comprehensive trading strategy alongside other technical and fundamental analysis methods.
Disclaimer: Trading involves substantial risk. This indicator does not guarantee profitable trades. Always perform your own analysis and risk management.
สคริปต์ที่ได้รับการป้องกัน
สคริปต์นี้ถูกเผยแพร่เป็นแบบ closed-source However, you can use it freely and without any limitations – learn more here.
MARK N. ROGERS, MBA
Rogers1906.com
Rogers1906.com
คำจำกัดสิทธิ์ความรับผิดชอบ
The information and publications are not meant to be, and do not constitute, financial, investment, trading, or other types of advice or recommendations supplied or endorsed by TradingView. Read more in the Terms of Use.