PROTECTED SOURCE SCRIPT
ที่อัปเดต: Best Liquidity Indicator v0.6.3
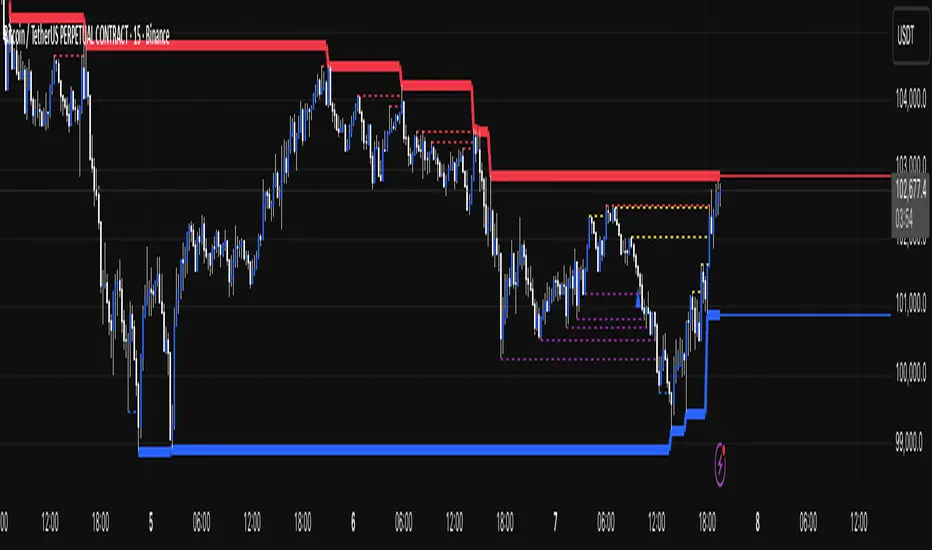
Best Liquidity Indicator (BLI)
BLI maps where liquidity typically sits—and when it gets taken. It automatically draws:
BLI maps where liquidity typically sits—and when it gets taken. It automatically draws:
- Sell-side liquidity (SSL) levels and Buy-side liquidity (BSL) levels
- Liquidity grabs when price runs a level
- Ex-liquidity (invalidated/older grabs) to show the evolving path of least resistance
- (Optional) Liquidity Rails: continuous, flat “stairs” that follow only active liquidity levels to give you a smooth, higher-level read of the market’s liquidity envelope
- (Optional) the same logic from a higher timeframe (e.g., 4H) overlaid on your current chart
เอกสารเผยแพร่
- Fixed issues preventing HTF liquidity levels from showing on the chart.
- Made Improvements to the Liquidity rail lines. (Further improvements to come in next version.
สคริปต์ที่ได้รับการป้องกัน
สคริปต์นี้ถูกเผยแพร่เป็นแบบ closed-source อย่างไรก็ตาม คุณสามารถใช้ได้อย่างอิสระและไม่มีข้อจำกัดใดๆ – เรียนรู้เพิ่มเติมได้ที่นี่
คำจำกัดสิทธิ์ความรับผิดชอบ
ข้อมูลและบทความไม่ได้มีวัตถุประสงค์เพื่อก่อให้เกิดกิจกรรมทางการเงิน, การลงทุน, การซื้อขาย, ข้อเสนอแนะ หรือคำแนะนำประเภทอื่น ๆ ที่ให้หรือรับรองโดย TradingView อ่านเพิ่มเติมที่ ข้อกำหนดการใช้งาน