OPEN-SOURCE SCRIPT
VIX:VIX3M Ratio
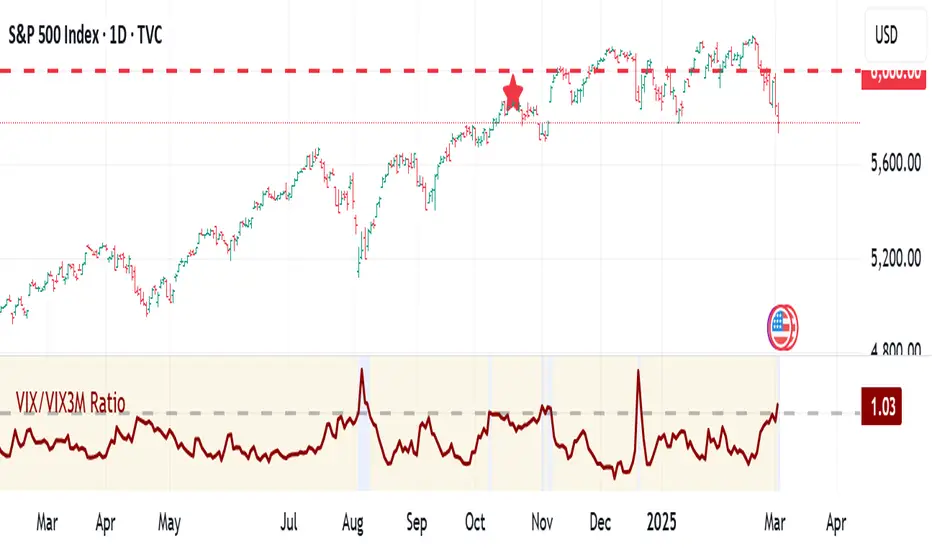
The VIX/VIX3M Ratio indicator compares the short-term (1-month) volatility index (VIX) to the medium-term (3-month) volatility index (VIX3M). This ratio provides insights into the market's volatility expectations across different time horizons.
Key Interpretations:
Potential Trading Insights:
Key Interpretations:
- Ratio > 1: Short-term volatility expectations are higher than 3-month expectations
- Ratio = 1: Short-term and medium-term volatility expectations are aligned
- Ratio < 1: Medium-term volatility expectations are higher than short-term expectations
Potential Trading Insights:
- A rising ratio may indicate increasing near-term market uncertainty
- Significant deviations from 1.0 can signal potential market stress or changing risk perceptions
- Traders use this to gauge the term structure of market volatility
สคริปต์โอเพนซอร์ซ
ด้วยเจตนารมณ์หลักของ TradingView ผู้สร้างสคริปต์นี้ได้ทำให้เป็นโอเพนซอร์ส เพื่อให้เทรดเดอร์สามารถตรวจสอบและยืนยันฟังก์ชันการทำงานของมันได้ ขอชื่นชมผู้เขียน! แม้ว่าคุณจะใช้งานได้ฟรี แต่โปรดจำไว้ว่าการเผยแพร่โค้ดซ้ำจะต้องเป็นไปตาม กฎระเบียบการใช้งาน ของเรา
คำจำกัดสิทธิ์ความรับผิดชอบ
ข้อมูลและบทความไม่ได้มีวัตถุประสงค์เพื่อก่อให้เกิดกิจกรรมทางการเงิน, การลงทุน, การซื้อขาย, ข้อเสนอแนะ หรือคำแนะนำประเภทอื่น ๆ ที่ให้หรือรับรองโดย TradingView อ่านเพิ่มเติมใน ข้อกำหนดการใช้งาน