OPEN-SOURCE SCRIPT
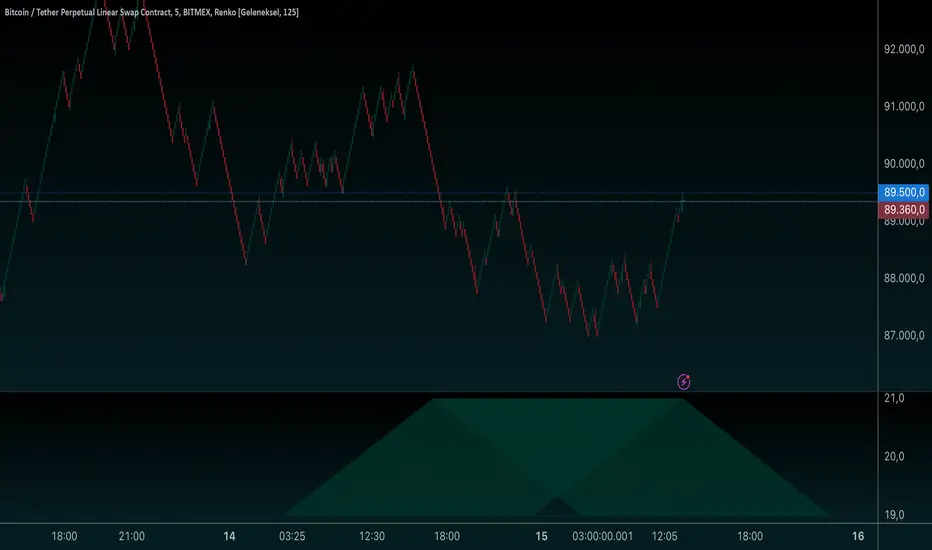
Platonic Solids Visualization-Scret Geometry-AYNET

Explanation:
Input Options:
solid: Choose the type of Platonic Solid (Tetrahedron, Cube, Octahedron, etc.).
size: Adjust the size of the geometry.
color_lines: Choose the color for the edges.
line_width: Set the width of the edges.
Geometry Calculations:
Each solid is drawn based on predefined coordinates and connected using the line.new function.
Geometric Types Supported:
Tetrahedron: A triangular pyramid.
Cube: A square-based 2D projection.
Octahedron: Two pyramids joined at the base.
Unsupported Solids:
Dodecahedron and Icosahedron are geometrically more complex and not rendered in this basic implementation.
Visualization:
The chosen Platonic Solid will be drawn relative to the center position (center_y) on the chart.
Adjust the size and center_y inputs to position the shape correctly.
Let me know if you need improvements or have a specific geometry to implement!
สคริปต์โอเพนซอร์ซ
ด้วยเจตนารมณ์หลักของ TradingView ผู้สร้างสคริปต์นี้ได้ทำให้เป็นโอเพนซอร์ส เพื่อให้เทรดเดอร์สามารถตรวจสอบและยืนยันฟังก์ชันการทำงานของมันได้ ขอชื่นชมผู้เขียน! แม้ว่าคุณจะใช้งานได้ฟรี แต่โปรดจำไว้ว่าการเผยแพร่โค้ดซ้ำจะต้องเป็นไปตาม กฎระเบียบการใช้งาน ของเรา
คำจำกัดสิทธิ์ความรับผิดชอบ
ข้อมูลและบทความไม่ได้มีวัตถุประสงค์เพื่อก่อให้เกิดกิจกรรมทางการเงิน, การลงทุน, การซื้อขาย, ข้อเสนอแนะ หรือคำแนะนำประเภทอื่น ๆ ที่ให้หรือรับรองโดย TradingView อ่านเพิ่มเติมใน ข้อกำหนดการใช้งาน