OPEN-SOURCE SCRIPT
Volume-MACD-RSI Integrated Strategy

Description:
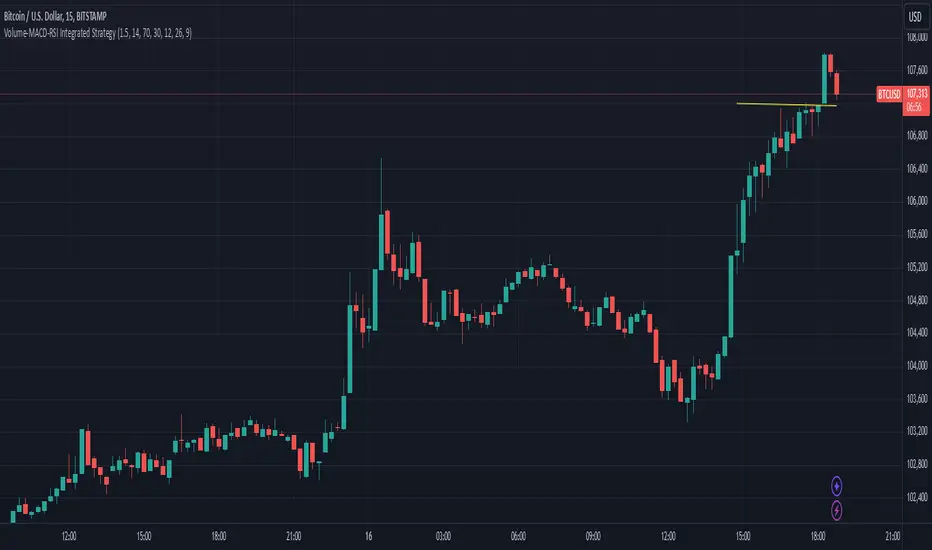
This script integrates three well-known technical analysis tools—Volume, MACD, and RSI—into a single signal meant to help traders identify potential turning points under strong market conditions.
Concept Overview:
Volume Filter: We compare the current bar’s volume to a 20-period volume average and require it to exceed a specified multiplier. This ensures that signals occur only during periods of heightened market participation. The logic is that moves on low volume are less reliable, so we wait for increased activity to confirm potential trend changes.
MACD Momentum Shift:
We incorporate MACD crossovers to determine when momentum is changing direction. MACD is a popular momentum indicator that identifies shifts in trend by comparing short-term and long-term EMAs. A bullish crossover (MACD line crossing above the signal line) may suggest upward momentum is building, while a bearish crossunder can indicate momentum turning downward.
RSI Market Condition Check:
RSI helps us identify overbought or oversold conditions. By requiring that RSI be oversold on buy signals and overbought on sell signals, we attempt to pinpoint entries where price could be at an extreme. The idea is to position entries or exits at junctures where price may be due for a reversal.
How the Script Works Together:
Volume Confirmation: No signals fire unless there’s strong volume. This reduces false positives.
MACD Momentum Check: Once volume confirms market interest, MACD crossover events serve as a trigger to initiate consideration of a trade signal.
RSI Condition: Finally, RSI determines whether the market is at an extreme. This final layer helps ensure we only act on signals that have both momentum shift and a price at an extreme level, potentially increasing the reliability of signals.
Intended Use:
This script can help highlight potential reversal points or trend shifts during active market periods.
Traders can use these signals as a starting point for deeper analysis. For instance, a “BUY” arrow may prompt a trader to investigate the market context, confirm with other methods, or look for patterns that further support a long entry.
The script is best used on markets with reliable volume data, such as stocks or futures, and can be experimented with across different timeframes. Adjusting the RSI thresholds, MACD parameters, and volume multiplier can help tailor it to specific instruments or trading styles.
Chart Setup:
When adding this script to your chart, it should be the only indicator present, so you can clearly see the red “BUY” arrows and green “SELL” arrows at the candle closes where signals occur.
The chart should be kept clean and uncluttered for clarity. No other indicators are necessary since the logic is already integrated into this single script.
สคริปต์โอเพนซอร์ซ
ด้วยเจตนารมณ์หลักของ TradingView ผู้สร้างสคริปต์นี้ได้ทำให้เป็นโอเพนซอร์ส เพื่อให้เทรดเดอร์สามารถตรวจสอบและยืนยันฟังก์ชันการทำงานของมันได้ ขอชื่นชมผู้เขียน! แม้ว่าคุณจะใช้งานได้ฟรี แต่โปรดจำไว้ว่าการเผยแพร่โค้ดซ้ำจะต้องเป็นไปตาม กฎระเบียบการใช้งาน ของเรา
คำจำกัดสิทธิ์ความรับผิดชอบ
ข้อมูลและบทความไม่ได้มีวัตถุประสงค์เพื่อก่อให้เกิดกิจกรรมทางการเงิน, การลงทุน, การซื้อขาย, ข้อเสนอแนะ หรือคำแนะนำประเภทอื่น ๆ ที่ให้หรือรับรองโดย TradingView อ่านเพิ่มเติมใน ข้อกำหนดการใช้งาน