PROTECTED SOURCE SCRIPT
ที่อัปเดต: Bitcoin Heatmap (by Alex L.)
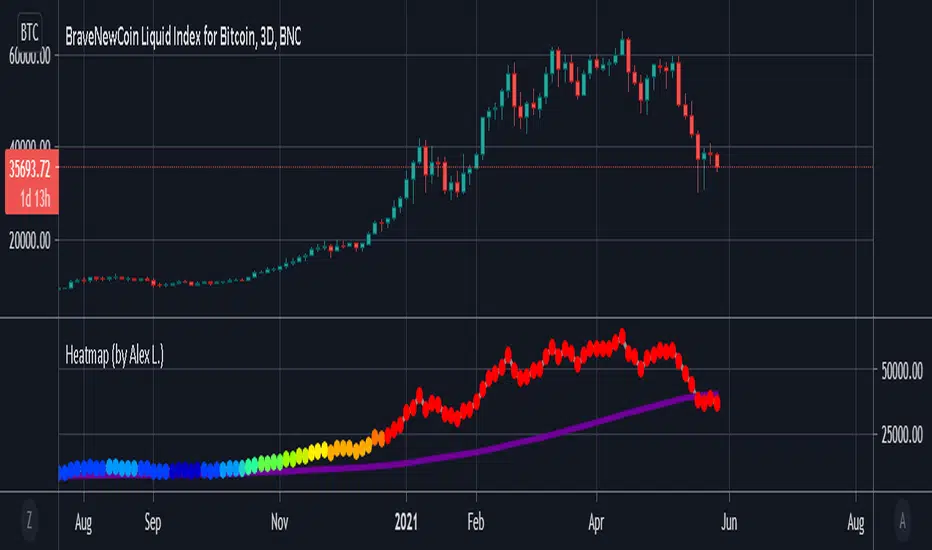
This indicator is a based on "200 Week Moving Average Heatmap" by Plan B. It shows "heatmap" of a security based on % increase of its 200 week (or other) moving average. It can be used for Bitcoin, as well identifying overheated Stocks (like TSLA). Plan B designed this indicator for Bitcoin using MA = 1400 (which is 200 trading days in Crypto), I personally found it useful to indicate overheated Stock Market stocks using MA = 250 (which is ~1 year of net trading days, excluding weekends and holidays).
Enjoy!
Enjoy!
เอกสารเผยแพร่
Fix for edge case where if smaller MA was used (not the default 1400) and if MA % of a certain bar was more than 100% then "Heatmap" circle would not be painted in "red", now it will be.สคริปต์ที่ได้รับการป้องกัน
สคริปต์นี้ถูกเผยแพร่เป็นแบบ closed-source อย่างไรก็ตาม คุณสามารถใช้ได้อย่างอิสระและไม่มีข้อจำกัดใดๆ – เรียนรู้เพิ่มเติมได้ที่นี่
คำจำกัดสิทธิ์ความรับผิดชอบ
ข้อมูลและบทความไม่ได้มีวัตถุประสงค์เพื่อก่อให้เกิดกิจกรรมทางการเงิน, การลงทุน, การซื้อขาย, ข้อเสนอแนะ หรือคำแนะนำประเภทอื่น ๆ ที่ให้หรือรับรองโดย TradingView อ่านเพิ่มเติมใน ข้อกำหนดการใช้งาน
สคริปต์ที่ได้รับการป้องกัน
สคริปต์นี้ถูกเผยแพร่เป็นแบบ closed-source อย่างไรก็ตาม คุณสามารถใช้ได้อย่างอิสระและไม่มีข้อจำกัดใดๆ – เรียนรู้เพิ่มเติมได้ที่นี่
คำจำกัดสิทธิ์ความรับผิดชอบ
ข้อมูลและบทความไม่ได้มีวัตถุประสงค์เพื่อก่อให้เกิดกิจกรรมทางการเงิน, การลงทุน, การซื้อขาย, ข้อเสนอแนะ หรือคำแนะนำประเภทอื่น ๆ ที่ให้หรือรับรองโดย TradingView อ่านเพิ่มเติมใน ข้อกำหนดการใช้งาน