OPEN-SOURCE SCRIPT
Long Short Momentum
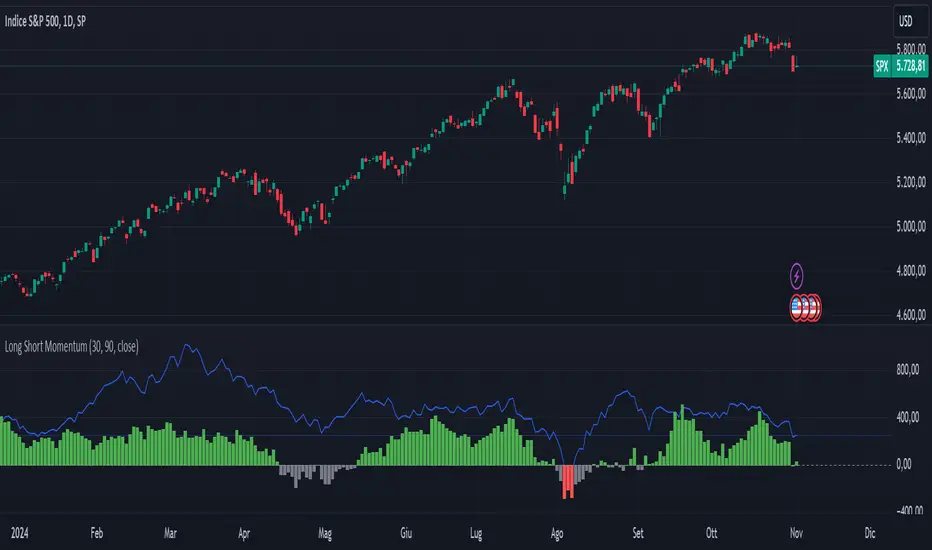
This indicator is designed to visualize short-term and long-term momentum trends.The indicator calculates two momentum lines based on customizable lengths: a short momentum (Short Momentum) over a smaller period and a long momentum (Long Momentum) over a longer period. These lines are plotted relative to the chosen price source, typically the closing price.
The histogram, colored dynamically based on momentum direction, gives visual cues:
The histogram, colored dynamically based on momentum direction, gives visual cues:
- Green: Both short and long momentum are positive, indicating an upward trend.
- Red: Both are negative, indicating a downward trend.
- Gray: Mixed momentum, suggesting potential trend indecision.
สคริปต์โอเพนซอร์ซ
ด้วยเจตนารมณ์หลักของ TradingView ผู้สร้างสคริปต์นี้ได้ทำให้เป็นโอเพนซอร์ส เพื่อให้เทรดเดอร์สามารถตรวจสอบและยืนยันฟังก์ชันการทำงานของมันได้ ขอชื่นชมผู้เขียน! แม้ว่าคุณจะใช้งานได้ฟรี แต่โปรดจำไว้ว่าการเผยแพร่โค้ดซ้ำจะต้องเป็นไปตาม กฎระเบียบการใช้งาน ของเรา
คำจำกัดสิทธิ์ความรับผิดชอบ
ข้อมูลและบทความไม่ได้มีวัตถุประสงค์เพื่อก่อให้เกิดกิจกรรมทางการเงิน, การลงทุน, การซื้อขาย, ข้อเสนอแนะ หรือคำแนะนำประเภทอื่น ๆ ที่ให้หรือรับรองโดย TradingView อ่านเพิ่มเติมใน ข้อกำหนดการใช้งาน