PROTECTED SOURCE SCRIPT
[LTS] LHAMA Consolidation Detector Pro
LHAMA Consolidation Detector Pro
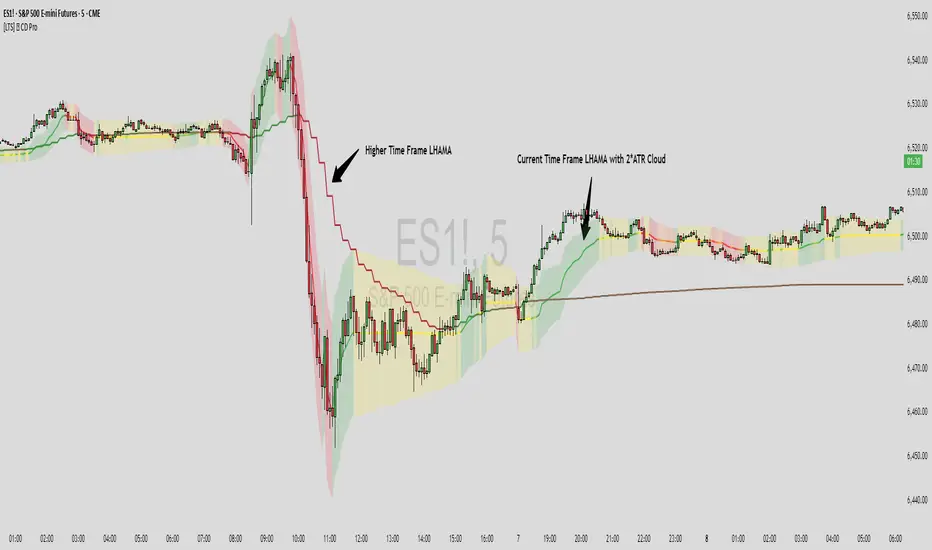
The LHAMA (Low-High Adaptive Moving Average) Consolidation Detector Pro is an advanced technical analysis tool that displays up to 6 adaptive moving averages with automatic slope detection and visual consolidation identification. This indicator helps traders identify trending versus sideways market conditions across multiple timeframes simultaneously.
What is LHAMA?
LHAMA (pronounced "llama" 🦙) is an adaptive moving average that responds dynamically to market conditions by monitoring when price breaks above recent highs or below recent lows. Unlike traditional moving averages that use fixed smoothing factors, LHAMA increases its responsiveness during trending periods and becomes more stable during consolidation phases.
Key Features:
How to Use:
Settings Explanation:
Technical Details:
The indicator uses a proprietary adaptive algorithm that:
Color Logic:
The slope detection system calculates a normalized angle of the LHAMA line. This ensures consistent color behavior whether trading stocks, forex, crypto, or futures without requiring the manual sensitivity adjustments of the basic version of this indicator.
Best Practices:
This indicator is suitable for all markets and timeframes, providing traders with a sophisticated tool for identifying market structure and potential trading opportunities through advanced adaptive moving average technology.
The LHAMA (Low-High Adaptive Moving Average) Consolidation Detector Pro is an advanced technical analysis tool that displays up to 6 adaptive moving averages with automatic slope detection and visual consolidation identification. This indicator helps traders identify trending versus sideways market conditions across multiple timeframes simultaneously.
What is LHAMA?
LHAMA (pronounced "llama" 🦙) is an adaptive moving average that responds dynamically to market conditions by monitoring when price breaks above recent highs or below recent lows. Unlike traditional moving averages that use fixed smoothing factors, LHAMA increases its responsiveness during trending periods and becomes more stable during consolidation phases.
Key Features:
- Up to 6 independent LHAMA lines with customizable parameters
- Multi-timeframe analysis - each line can use different timeframes
- Automatic slope detection and normalization (works across all instruments without manual adjustment)
- Dynamic color coding: bullish (uptrend), bearish (downtrend), and flat (consolidation) states
- Optional volume weighting for increased responsiveness during high-volume periods
- Daily reset functionality to handle overnight gaps (useful for futures markets)
- Optional cloud display around each LHAMA line for enhanced visual clarity
- Optimized performance - disabled lines consume zero computational resources
How to Use:
- Trend Identification: Easily identify when a move is significant by checking the color of the LHAMA line
- Consolidation Detection: Even if price seems to be moving in a trend, the LHAMA line can help you determine if it is meaningful movement or just noise.
- Multiple Timeframe Analysis: Enable multiple LHAMA lines with different lengths and timeframes to see trend alignment
- Support/Resistance: LHAMA lines often act as dynamic support and resistance levels
Settings Explanation:
- Length: Period for LHAMA calculation (shorter = more responsive, longer = smoother)
- Volume Weight: Makes LHAMA more responsive during high volume periods
- Color Sensitivity: Global setting that determines how quickly colors change based on slope angle. This lets you choose just how flat a "flat" line actually is.
- Daily Reset: Optionally resets LHAMA to current price at specified time to avoid drift during session gaps.
- Cloud Display: Shows volatility-based bands around LHAMA lines using ATR or Standard Deviation
- Timeframe: Each LHAMA line can analyze a different timeframe independently.
- Colors: Each LHAMA line can be customized with its own distinct colors for clean, easy visuals.
Technical Details:
The indicator uses a proprietary adaptive algorithm that:
- Monitors price breakouts
- Applies volume weighting when enabled
- Uses slope normalization for consistent performance across all instruments
- Implements efficient conditional processing to minimize computational overhead
Color Logic:
The slope detection system calculates a normalized angle of the LHAMA line. This ensures consistent color behavior whether trading stocks, forex, crypto, or futures without requiring the manual sensitivity adjustments of the basic version of this indicator.
- Angles less than 5 degrees (default) are considered "flat" (consolidation)
- Steeper angles transition smoothly between flat and trend colors
- The Sensitivity and Length settings allow fine-tuning for different trading styles
Best Practices:
- Start with LHAMA 1 enabled using default settings to understand the indicator
- Enable volatility bands to help determine possible TP/SL placement
- Use multiple LHAMA lines with different lengths (e.g., 14, 34, 89) or time frames for comprehensive analysis
- Combine with other technical analysis tools for confirmation
- Adjust the Color Sensitivity setting based on your preferred responsiveness
- Enable Daily Reset for instruments with significant overnight gaps
This indicator is suitable for all markets and timeframes, providing traders with a sophisticated tool for identifying market structure and potential trading opportunities through advanced adaptive moving average technology.
สคริปต์ที่ได้รับการป้องกัน
สคริปต์นี้ถูกเผยแพร่เป็นแบบ closed-source อย่างไรก็ตาม คุณสามารถใช้ได้อย่างอิสระและไม่มีข้อจำกัดใดๆ – เรียนรู้เพิ่มเติมได้ที่นี่
Creators of the LHAMA Trading Suite. Visit lhamatrading.com to unlock all our indicators.
Skip the drama, ride the LHAMA!
Skip the drama, ride the LHAMA!
คำจำกัดสิทธิ์ความรับผิดชอบ
ข้อมูลและบทความไม่ได้มีวัตถุประสงค์เพื่อก่อให้เกิดกิจกรรมทางการเงิน, การลงทุน, การซื้อขาย, ข้อเสนอแนะ หรือคำแนะนำประเภทอื่น ๆ ที่ให้หรือรับรองโดย TradingView อ่านเพิ่มเติมที่ ข้อกำหนดการใช้งาน