PROTECTED SOURCE SCRIPT
ที่อัปเดต: Multi Time Frame RSI [Horizonn Wealth]
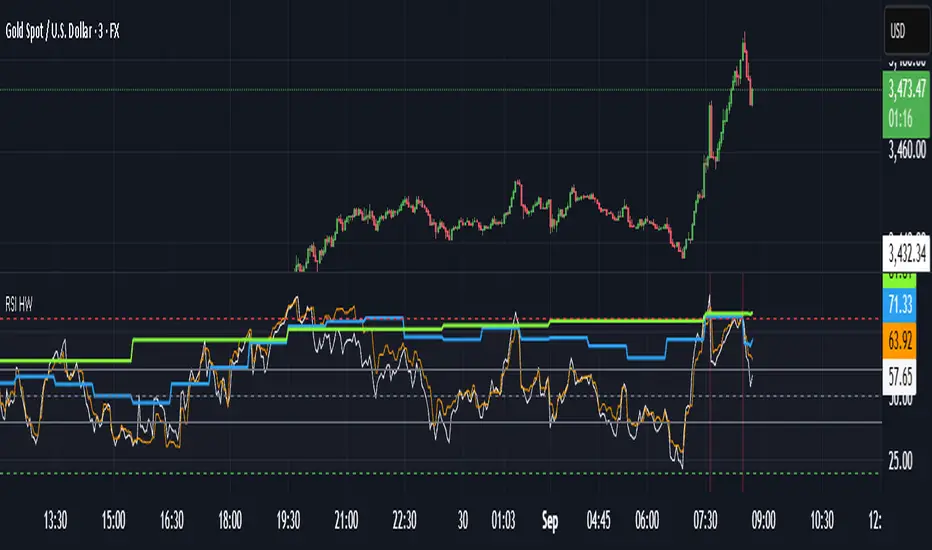
Multi-Time Frame Analysis: A key feature is the ability to choose a time frame for each of the four RSI lines from a predefined list (Chart, 1 day, 1 week, 1 month). The script uses the request.security() function with lookahead enabled to ensure the most accurate, real-time data is used for each calculation, eliminating look-ahead bias and calculation errors.
Visual Levels: The indicator plots standard RSI levels at 30, 50, and 70, with a shaded background between the oversold (30) and overbought (70) zones to provide a clear visual reference.
Momentum Alignment Signals: The script includes an optional feature that highlights the chart's background with a red or green color when all four RSIs simultaneously enter an overbought or oversold state. This serves as an immediate visual alert for a strong, multi-time frame momentum condition.
This indicator is a robust tool for technical analysis, suitable for traders who use a top-down approach to their market analysis.
เอกสารเผยแพร่
Multi-Time Frame Analysis: A key feature is the ability to choose a time frame for each of the four RSI lines from a predefined list (Chart, 1 day, 1 week, 1 month). The script uses the request.security() function with lookahead enabled to ensure the most accurate, real-time data is used for each calculation, eliminating look-ahead bias and calculation errors.Visual Levels: The indicator plots standard RSI levels at 30, 50, and 70, with a shaded background between the oversold (30) and overbought (70) zones to provide a clear visual reference.
Momentum Alignment Signals: The script includes an optional feature that highlights the chart's background with a red or green color when all four RSIs simultaneously enter an overbought or oversold state. This serves as an immediate visual alert for a strong, multi-time frame momentum condition.
This indicator is a robust tool for technical analysis, suitable for traders who use a top-down approach to their market analysis.
สคริปต์ที่ได้รับการป้องกัน
สคริปต์นี้ถูกเผยแพร่เป็นแบบ closed-source อย่างไรก็ตาม คุณสามารถใช้ได้อย่างอิสระและไม่มีข้อจำกัดใดๆ – เรียนรู้เพิ่มเติมได้ที่นี่
คำจำกัดสิทธิ์ความรับผิดชอบ
ข้อมูลและบทความไม่ได้มีวัตถุประสงค์เพื่อก่อให้เกิดกิจกรรมทางการเงิน, การลงทุน, การซื้อขาย, ข้อเสนอแนะ หรือคำแนะนำประเภทอื่น ๆ ที่ให้หรือรับรองโดย TradingView อ่านเพิ่มเติมใน ข้อกำหนดการใช้งาน