OPEN-SOURCE SCRIPT
Masonson QQQ Composite Strategy (3 Indicator Alert)
pinescript
//version=5
indicator("Masonson QQQ Composite Strategy (3 Indicator Alert)", overlay=true)
// Moving Averages
ma20 = ta.sma(close, 20)
ma50 = ta.sma(close, 50)
ma200 = ta.sma(close, 200)
// MACD
[macdLine, signalLine, _] = ta.macd(close, 12, 26, 9)
// RSI (7-period)
rsi = ta.rsi(close, 7)
// Bullish / Bearish Conditions
bullishCount = 0
bearishCount = 0
// Trend (Moving Averages)
if close > ma20 and ma20 > ma50
bullishCount += 1
if close < ma20 and ma20 < ma50
bearishCount += 1
// MACD Momentum
if macdLine > signalLine
bullishCount += 1
else if macdLine < signalLine
bearishCount += 1
// RSI Overbought / Oversold
if rsi < 30
bullishCount += 1
else if rsi > 70
bearishCount += 1
// Final Signal Logic
bullishSignal = bullishCount >= 2
bearishSignal = bearishCount >= 2
// Prevent simultaneous signals
if bullishSignal and bearishSignal
runtime.error("Error: Both bullish and bearish signals triggered!")
// Plotting Moving Averages
plot(ma20, color=color.new(color.yellow, 0), title="20 SMA", linewidth=2)
plot(ma50, color=color.new(color.orange, 0), title="50 SMA", linewidth=2)
plot(ma200, color=color.new(color.red, 0), title="200 SMA", linewidth=2)
// Cooldown logic for signals
var float lastSignalBar = na
canPlotBullish = na(lastSignalBar) or bar_index > lastSignalBar + 5
canPlotBearish = na(lastSignalBar) or bar_index > lastSignalBar + 5
// Update last signal bar
if bullishSignal and canPlotBullish
lastSignalBar := bar_index
if bearishSignal and canPlotBearish
lastSignalBar := bar_index
// Plot signals
plotshape(bullishSignal and canPlotBullish ? true : na, title="Bullish Signal", location=location.belowbar, color=color.new(color.lime, 0), style=shape.triangleup, size=size.normal, text="BUY")
plotshape(bearishSignal and canPlotBearish ? true : na, title="Bearish Signal", location=location.abovebar, color=color.new(color.red, 0), style=shape.triangledown, size=size.normal, text="SELL")
// Plot counts for use in alert messages
plot(bullishCount, title="Bullish Count", display=display.none)
plot(bearishCount, title="Bearish Count", display=display.none)
// Alerts with audible notification
alertcondition(bullishSignal and not bullishSignal[1], title="Bullish Alert", message="[Bullish Signal: {{ticker}} - LONG entry. Count: {{plot_0}}] {{alert.sonify}}")
alertcondition(bearishSignal and not bearishSignal[1], title="Bearish Alert", message="[Bearish Signal: {{ticker}} - EXIT or SHORT. Count: {{plot_1}}] {{alert.sonify}}")
// Info Table
var table infoTable = table.new(position.top_right, 2, 4, bgcolor=color.new(color.white, 80), border_width=1)
if barstate.islast
table.cell(infoTable, 0, 0, "Indicator", text_color=color.black, bgcolor=color.new(color.gray, 50))
table.cell(infoTable, 1, 0, "Value", text_color=color.black, bgcolor=color.new(color.gray, 50))
table.cell(infoTable, 0, 1, "Bullish Count", text_color=color.black)
table.cell(infoTable, 1, 1, str.tostring(bullishCount), text_color=color.green, bgcolor=color.new(color.green, 90))
table.cell(infoTable, 0, 2, "Bearish Count", text_color=color.black)
table.cell(infoTable, 1, 2, str.tostring(bearishCount), text_color=color.red, bgcolor=color.new(color.red, 90))
table.cell(infoTable, 0, 3, "Signal", text_color=color.black)
signalText = bullishSignal ? "BULLISH" : bearishSignal ? "BEARISH" : "NEUTRAL"
signalColor = bullishSignal ? color.green : bearishSignal ? color.red : color.gray
table.cell(infoTable, 1, 3, signalText, text_color=color.white, bgcolor=color.new(signalColor, 20))
Summary of How the Indicator Works
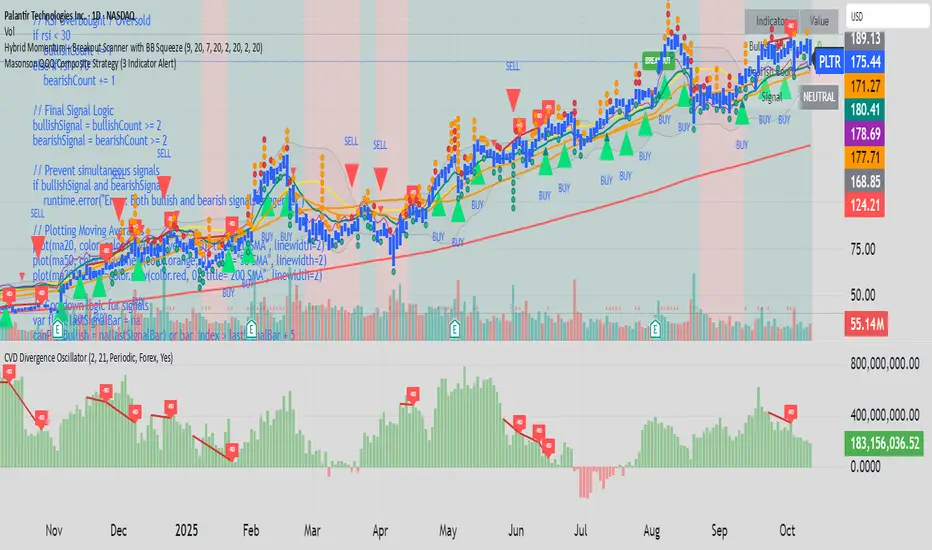
The Masonson QQQ Composite Strategy (3 Indicator Alert) is a Pine Script v5 indicator designed for the QQQ (Nasdaq-100 ETF) to identify bullish and bearish trading signals based on three technical indicators: Moving Averages, MACD, and RSI. It generates buy or sell signals when at least two of three conditions align, visualizes them on the chart, and provides audible alerts and an info table for real-time monitoring.
Indicators Used:
Moving Averages: Calculates 20-period, 50-period, and 200-period Simple Moving Averages (SMAs).
MACD: Uses standard settings (12, 26, 9) to compute the MACD line and signal line.
RSI: Calculates a 7-period Relative Strength Index to identify overbought (>70) or oversold (<30) conditions.
Signal Logic:
Bullish Conditions:
Price is above 20 SMA and 20 SMA is above 50 SMA (indicating an uptrend).
MACD line is above the signal line (indicating bullish momentum).
RSI is below 30 (indicating oversold conditions).
Bearish Conditions:
Price is below 20 SMA and 20 SMA is below 50 SMA (indicating a downtrend).
MACD line is below the signal line (indicating bearish momentum).
RSI is above 70 (indicating overbought conditions).
A counter (bullishCount or bearishCount) increments for each condition met.
A signal is generated if at least 2 out of 3 conditions are met (bullishSignal or bearishSignal).
Visualization:
Plots 20 SMA (yellow), 50 SMA (orange), and 200 SMA (red) on the chart.
Displays buy signals as green upward triangles labeled "BUY" below the bar and sell signals as red downward triangles labeled "SELL" above the bar.
Implements a 5-bar cooldown to prevent signal clutter.
Shows an info table in the top-right corner with:
Bullish Count (number of bullish conditions met).
Bearish Count (number of bearish conditions met).
Current signal status (BULLISH, BEARISH, or NEUTRAL).
Alerts:
Triggers audible alerts when a new bullish or bearish signal occurs (not on consecutive bars).
Alert messages include the ticker symbol and the respective count (e.g., "Bullish Signal: QQQ - LONG entry. Count: 2").
Uses {{alert.sonify}} for audible notifications in TradingView.
Safety Features:
Includes a check to prevent simultaneous bullish and bearish signals, raising a runtime error if both occur.
//version=5
indicator("Masonson QQQ Composite Strategy (3 Indicator Alert)", overlay=true)
// Moving Averages
ma20 = ta.sma(close, 20)
ma50 = ta.sma(close, 50)
ma200 = ta.sma(close, 200)
// MACD
[macdLine, signalLine, _] = ta.macd(close, 12, 26, 9)
// RSI (7-period)
rsi = ta.rsi(close, 7)
// Bullish / Bearish Conditions
bullishCount = 0
bearishCount = 0
// Trend (Moving Averages)
if close > ma20 and ma20 > ma50
bullishCount += 1
if close < ma20 and ma20 < ma50
bearishCount += 1
// MACD Momentum
if macdLine > signalLine
bullishCount += 1
else if macdLine < signalLine
bearishCount += 1
// RSI Overbought / Oversold
if rsi < 30
bullishCount += 1
else if rsi > 70
bearishCount += 1
// Final Signal Logic
bullishSignal = bullishCount >= 2
bearishSignal = bearishCount >= 2
// Prevent simultaneous signals
if bullishSignal and bearishSignal
runtime.error("Error: Both bullish and bearish signals triggered!")
// Plotting Moving Averages
plot(ma20, color=color.new(color.yellow, 0), title="20 SMA", linewidth=2)
plot(ma50, color=color.new(color.orange, 0), title="50 SMA", linewidth=2)
plot(ma200, color=color.new(color.red, 0), title="200 SMA", linewidth=2)
// Cooldown logic for signals
var float lastSignalBar = na
canPlotBullish = na(lastSignalBar) or bar_index > lastSignalBar + 5
canPlotBearish = na(lastSignalBar) or bar_index > lastSignalBar + 5
// Update last signal bar
if bullishSignal and canPlotBullish
lastSignalBar := bar_index
if bearishSignal and canPlotBearish
lastSignalBar := bar_index
// Plot signals
plotshape(bullishSignal and canPlotBullish ? true : na, title="Bullish Signal", location=location.belowbar, color=color.new(color.lime, 0), style=shape.triangleup, size=size.normal, text="BUY")
plotshape(bearishSignal and canPlotBearish ? true : na, title="Bearish Signal", location=location.abovebar, color=color.new(color.red, 0), style=shape.triangledown, size=size.normal, text="SELL")
// Plot counts for use in alert messages
plot(bullishCount, title="Bullish Count", display=display.none)
plot(bearishCount, title="Bearish Count", display=display.none)
// Alerts with audible notification
alertcondition(bullishSignal and not bullishSignal[1], title="Bullish Alert", message="[Bullish Signal: {{ticker}} - LONG entry. Count: {{plot_0}}] {{alert.sonify}}")
alertcondition(bearishSignal and not bearishSignal[1], title="Bearish Alert", message="[Bearish Signal: {{ticker}} - EXIT or SHORT. Count: {{plot_1}}] {{alert.sonify}}")
// Info Table
var table infoTable = table.new(position.top_right, 2, 4, bgcolor=color.new(color.white, 80), border_width=1)
if barstate.islast
table.cell(infoTable, 0, 0, "Indicator", text_color=color.black, bgcolor=color.new(color.gray, 50))
table.cell(infoTable, 1, 0, "Value", text_color=color.black, bgcolor=color.new(color.gray, 50))
table.cell(infoTable, 0, 1, "Bullish Count", text_color=color.black)
table.cell(infoTable, 1, 1, str.tostring(bullishCount), text_color=color.green, bgcolor=color.new(color.green, 90))
table.cell(infoTable, 0, 2, "Bearish Count", text_color=color.black)
table.cell(infoTable, 1, 2, str.tostring(bearishCount), text_color=color.red, bgcolor=color.new(color.red, 90))
table.cell(infoTable, 0, 3, "Signal", text_color=color.black)
signalText = bullishSignal ? "BULLISH" : bearishSignal ? "BEARISH" : "NEUTRAL"
signalColor = bullishSignal ? color.green : bearishSignal ? color.red : color.gray
table.cell(infoTable, 1, 3, signalText, text_color=color.white, bgcolor=color.new(signalColor, 20))
Summary of How the Indicator Works
The Masonson QQQ Composite Strategy (3 Indicator Alert) is a Pine Script v5 indicator designed for the QQQ (Nasdaq-100 ETF) to identify bullish and bearish trading signals based on three technical indicators: Moving Averages, MACD, and RSI. It generates buy or sell signals when at least two of three conditions align, visualizes them on the chart, and provides audible alerts and an info table for real-time monitoring.
Indicators Used:
Moving Averages: Calculates 20-period, 50-period, and 200-period Simple Moving Averages (SMAs).
MACD: Uses standard settings (12, 26, 9) to compute the MACD line and signal line.
RSI: Calculates a 7-period Relative Strength Index to identify overbought (>70) or oversold (<30) conditions.
Signal Logic:
Bullish Conditions:
Price is above 20 SMA and 20 SMA is above 50 SMA (indicating an uptrend).
MACD line is above the signal line (indicating bullish momentum).
RSI is below 30 (indicating oversold conditions).
Bearish Conditions:
Price is below 20 SMA and 20 SMA is below 50 SMA (indicating a downtrend).
MACD line is below the signal line (indicating bearish momentum).
RSI is above 70 (indicating overbought conditions).
A counter (bullishCount or bearishCount) increments for each condition met.
A signal is generated if at least 2 out of 3 conditions are met (bullishSignal or bearishSignal).
Visualization:
Plots 20 SMA (yellow), 50 SMA (orange), and 200 SMA (red) on the chart.
Displays buy signals as green upward triangles labeled "BUY" below the bar and sell signals as red downward triangles labeled "SELL" above the bar.
Implements a 5-bar cooldown to prevent signal clutter.
Shows an info table in the top-right corner with:
Bullish Count (number of bullish conditions met).
Bearish Count (number of bearish conditions met).
Current signal status (BULLISH, BEARISH, or NEUTRAL).
Alerts:
Triggers audible alerts when a new bullish or bearish signal occurs (not on consecutive bars).
Alert messages include the ticker symbol and the respective count (e.g., "Bullish Signal: QQQ - LONG entry. Count: 2").
Uses {{alert.sonify}} for audible notifications in TradingView.
Safety Features:
Includes a check to prevent simultaneous bullish and bearish signals, raising a runtime error if both occur.
สคริปต์โอเพนซอร์ซ
ด้วยเจตนารมณ์หลักของ TradingView ผู้สร้างสคริปต์นี้ได้ทำให้มันเป็นโอเพ่นซอร์ส เพื่อให้เทรดเดอร์สามารถตรวจสอบและยืนยันการทำงานของสคริปต์ได้ ขอแสดงความชื่นชมผู้เขียน! แม้ว่าคุณจะสามารถใช้งานได้ฟรี แต่อย่าลืมว่าการเผยแพร่โค้ดซ้ำนั้นจะต้องเป็นไปตามกฎระเบียบการใช้งานของเรา
คำจำกัดสิทธิ์ความรับผิดชอบ
ข้อมูลและบทความไม่ได้มีวัตถุประสงค์เพื่อก่อให้เกิดกิจกรรมทางการเงิน, การลงทุน, การซื้อขาย, ข้อเสนอแนะ หรือคำแนะนำประเภทอื่น ๆ ที่ให้หรือรับรองโดย TradingView อ่านเพิ่มเติมที่ ข้อกำหนดการใช้งาน