OPEN-SOURCE SCRIPT
ที่อัปเดต: RSI Dot Party - All Lengths From 1 To 120
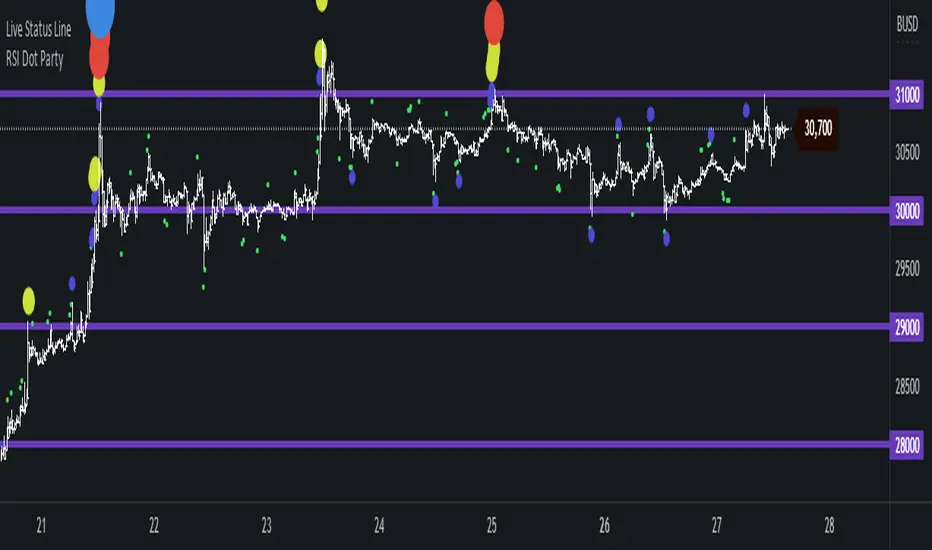
The RSI Dot Party indicator displays all RSI lengths from 1 to 120 as different colored dots on the chart.
🔶 Purpose
🔶 USAGE
🔶 SETTINGS
🔹 Source
🔹 Meta Settings
🔹 7 RSI Groups
🔹 RSI Group Settings
🔹 Show
🔶 ALERTS
🔶 Warning
🔶 Community
I hope you guys find this useful, if you have any questions or feature requests leave me a comment! Take care :D
🔶 Purpose
- Show the reversal point of price action to time entries and exits.
🔶 USAGE
- When a dot displays it is a indication of the reversal of the price/trend. The larger the dot the more likely it is to reverse.
- The Default settings generates dots for extreme cases where the RSI is over = 90 or under = 10 for every RSI length in the range of 1-120.
- Example if the RSI of length 1 or 2 or 3 or 4 or ... or 15 or 16 or 17 or ... or 80 or 81 or 82 or ... if any of does RSI crosses a boundary a dot is shown.
- A boundary is the over/under the RSI oscillates in.
- Customize the settings until the dots match up with the high and lows of past price action.
🔶 SETTINGS
🔹 Source
- Source 1: Is the First Source RSI is calculated from
- Source 2: Is the Second Source RSI is calculated from
🔹 Meta Settings
- Hours back to draw: To speed up the script calculate it only draws a set number of hours back, default is 300 hours back in time to draw then it cuts off.
- Show Dots: Show or disable dots
- Show Bar Color: Color the bars for each RSI incident
- Filter Cross: Filters and only shows dots when the RSI crosses above or bellow a boundary. If not all candles above or bellow the boundaries will display a dot.
- Dots Location Absolute: Instead of showing the dots above or bellow the candle, the dots will show up on the top and bottom of the window.
🔹 7 RSI Groups
- There are a total of 7 RSI colors.
- Range Very Tiny: Default Color Green
- Range Tiny: Default Color Purple
- Range Small: Default Color Yellow
- Range Normal: Default Color Red
- Range Large: Default Color Blue
- Range Huge: Default Color Dark Purple
- Range Very Huge: Default Color White
🔹 RSI Group Settings
- Hi/Low Color: Change the Color of that group.
- Start/End: The Start and End range of this RSI color. Example if start = 5 and end = 10 the RSI of 5,6,7,8,9,10 will be displayed on the chart for that color, if any of does RSI goes above or bellow the boundary a dot is displayed on that candle.
- Delay: The RSI needs to be above or bellow a boundary for x number of candles before displaying a dot. For example if delay = 2 and the RSI is over = 70 for 2 candles then it will display a dot.
- Under/Over: Boundaries that indicate when to draw a dot, if over = 70 and RSI crosses above 70 a dot is displayed.
🔹 Show
- Section that allows you to disable RSI grounds you dont want to see, this also removes them from the alert signal generated.
- Show Low: Show or disable Low RSI dots
- Show High: Show or disable High RSI dots
🔶 ALERTS
- Alert for all New RSIs Dots Created in real time
- The alert generated depends on what groups are showing or not, if the green group is disabled for example the alert will not be generated.
🔶 Warning
- When a dot shows up it can continue moving. For example if a purple dot shows itself above a 15 minute candle, if that candle/price continue to extend up the dot will move up with it.
- Dots can also disappear occasionally if the RSI moves in and out of a boundary within that candles life span.
🔶 Community
I hope you guys find this useful, if you have any questions or feature requests leave me a comment! Take care :D
เอกสารเผยแพร่
- Updated Settings making it more intuitive
เอกสารเผยแพร่
- Fixed redraw but historical data will no longer match up in real time, if dot cross above and bellow a boundary during that candles life span the dot will no longer disappear.
เอกสารเผยแพร่
Speed up: Removed Second SourceAdded Realtime, Confirmed or Default behavior option in settings
สคริปต์โอเพนซอร์ซ
ด้วยเจตนารมณ์หลักของ TradingView ผู้สร้างสคริปต์นี้ได้ทำให้เป็นโอเพนซอร์ส เพื่อให้เทรดเดอร์สามารถตรวจสอบและยืนยันฟังก์ชันการทำงานของมันได้ ขอชื่นชมผู้เขียน! แม้ว่าคุณจะใช้งานได้ฟรี แต่โปรดจำไว้ว่าการเผยแพร่โค้ดซ้ำจะต้องเป็นไปตาม กฎระเบียบการใช้งาน ของเรา
คำจำกัดสิทธิ์ความรับผิดชอบ
ข้อมูลและบทความไม่ได้มีวัตถุประสงค์เพื่อก่อให้เกิดกิจกรรมทางการเงิน, การลงทุน, การซื้อขาย, ข้อเสนอแนะ หรือคำแนะนำประเภทอื่น ๆ ที่ให้หรือรับรองโดย TradingView อ่านเพิ่มเติมใน ข้อกำหนดการใช้งาน